Video
Monitor your account: Build dashboards in your BI tool
Description
Visualizing your Fivetran pipeline performance and usage in the business intelligence (BI) tool of your choice makes it easy to monitor your connectors and usage in the platforms you use every day. After setting up the free Fivetran Platform connector and Quickstart data model, you’re ready to build a dashboard for easy insights.
In this video, you’ll learn how to:
- Review sample queries for key metrics such as monthly active rows, daily records modified and user audits.
- Visualize pipeline performance in Power BI by looking at table-level metrics, like sync frequency and performance (e.g., min, max and average sync times).
- Leverage variance logic to track performance deviations (e.g., ±20-30%) and identify potential optimizations.
- Utilize metadata screens to access schema, table and column mappings easily, making data exploration more intuitive.
More videos
Video

1:17
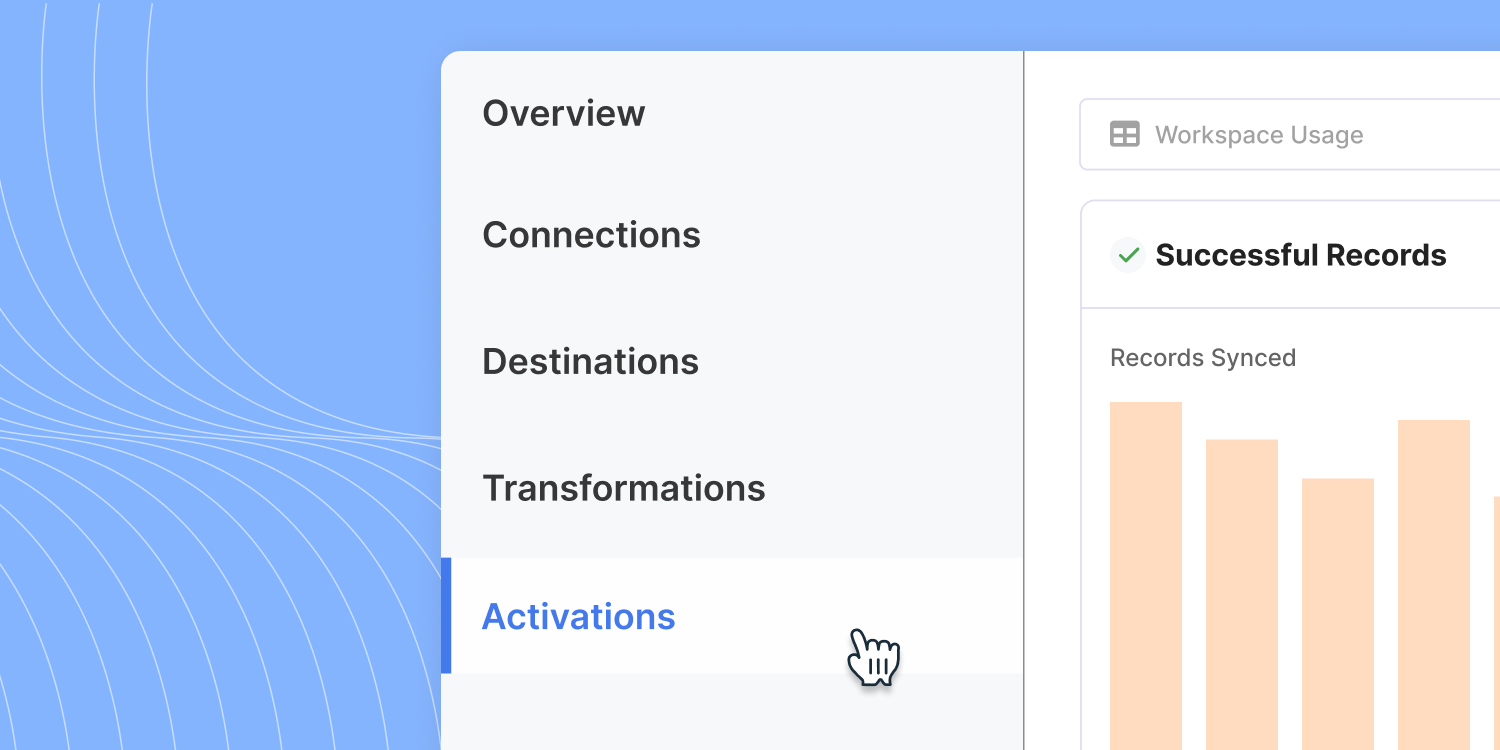
How to use Activations
Video
5:32
Fivetran Trial Pro Tips
Video
8:25
Best practices: Building and managing connectors

Video
9:13
Best practices: Platform tools and account management
Video
8:25
Best practices: Connector sync strategies and features
Video
4:21
How to set up Snowflake for your Fivetran trial

Video
01:51
How to set up a connection with Fivetran Connector SDK
Video
4:30
How to use Fivetran's managed data lakes service

Video
03:03
How to submit a support ticket
.png)
Video
06:12
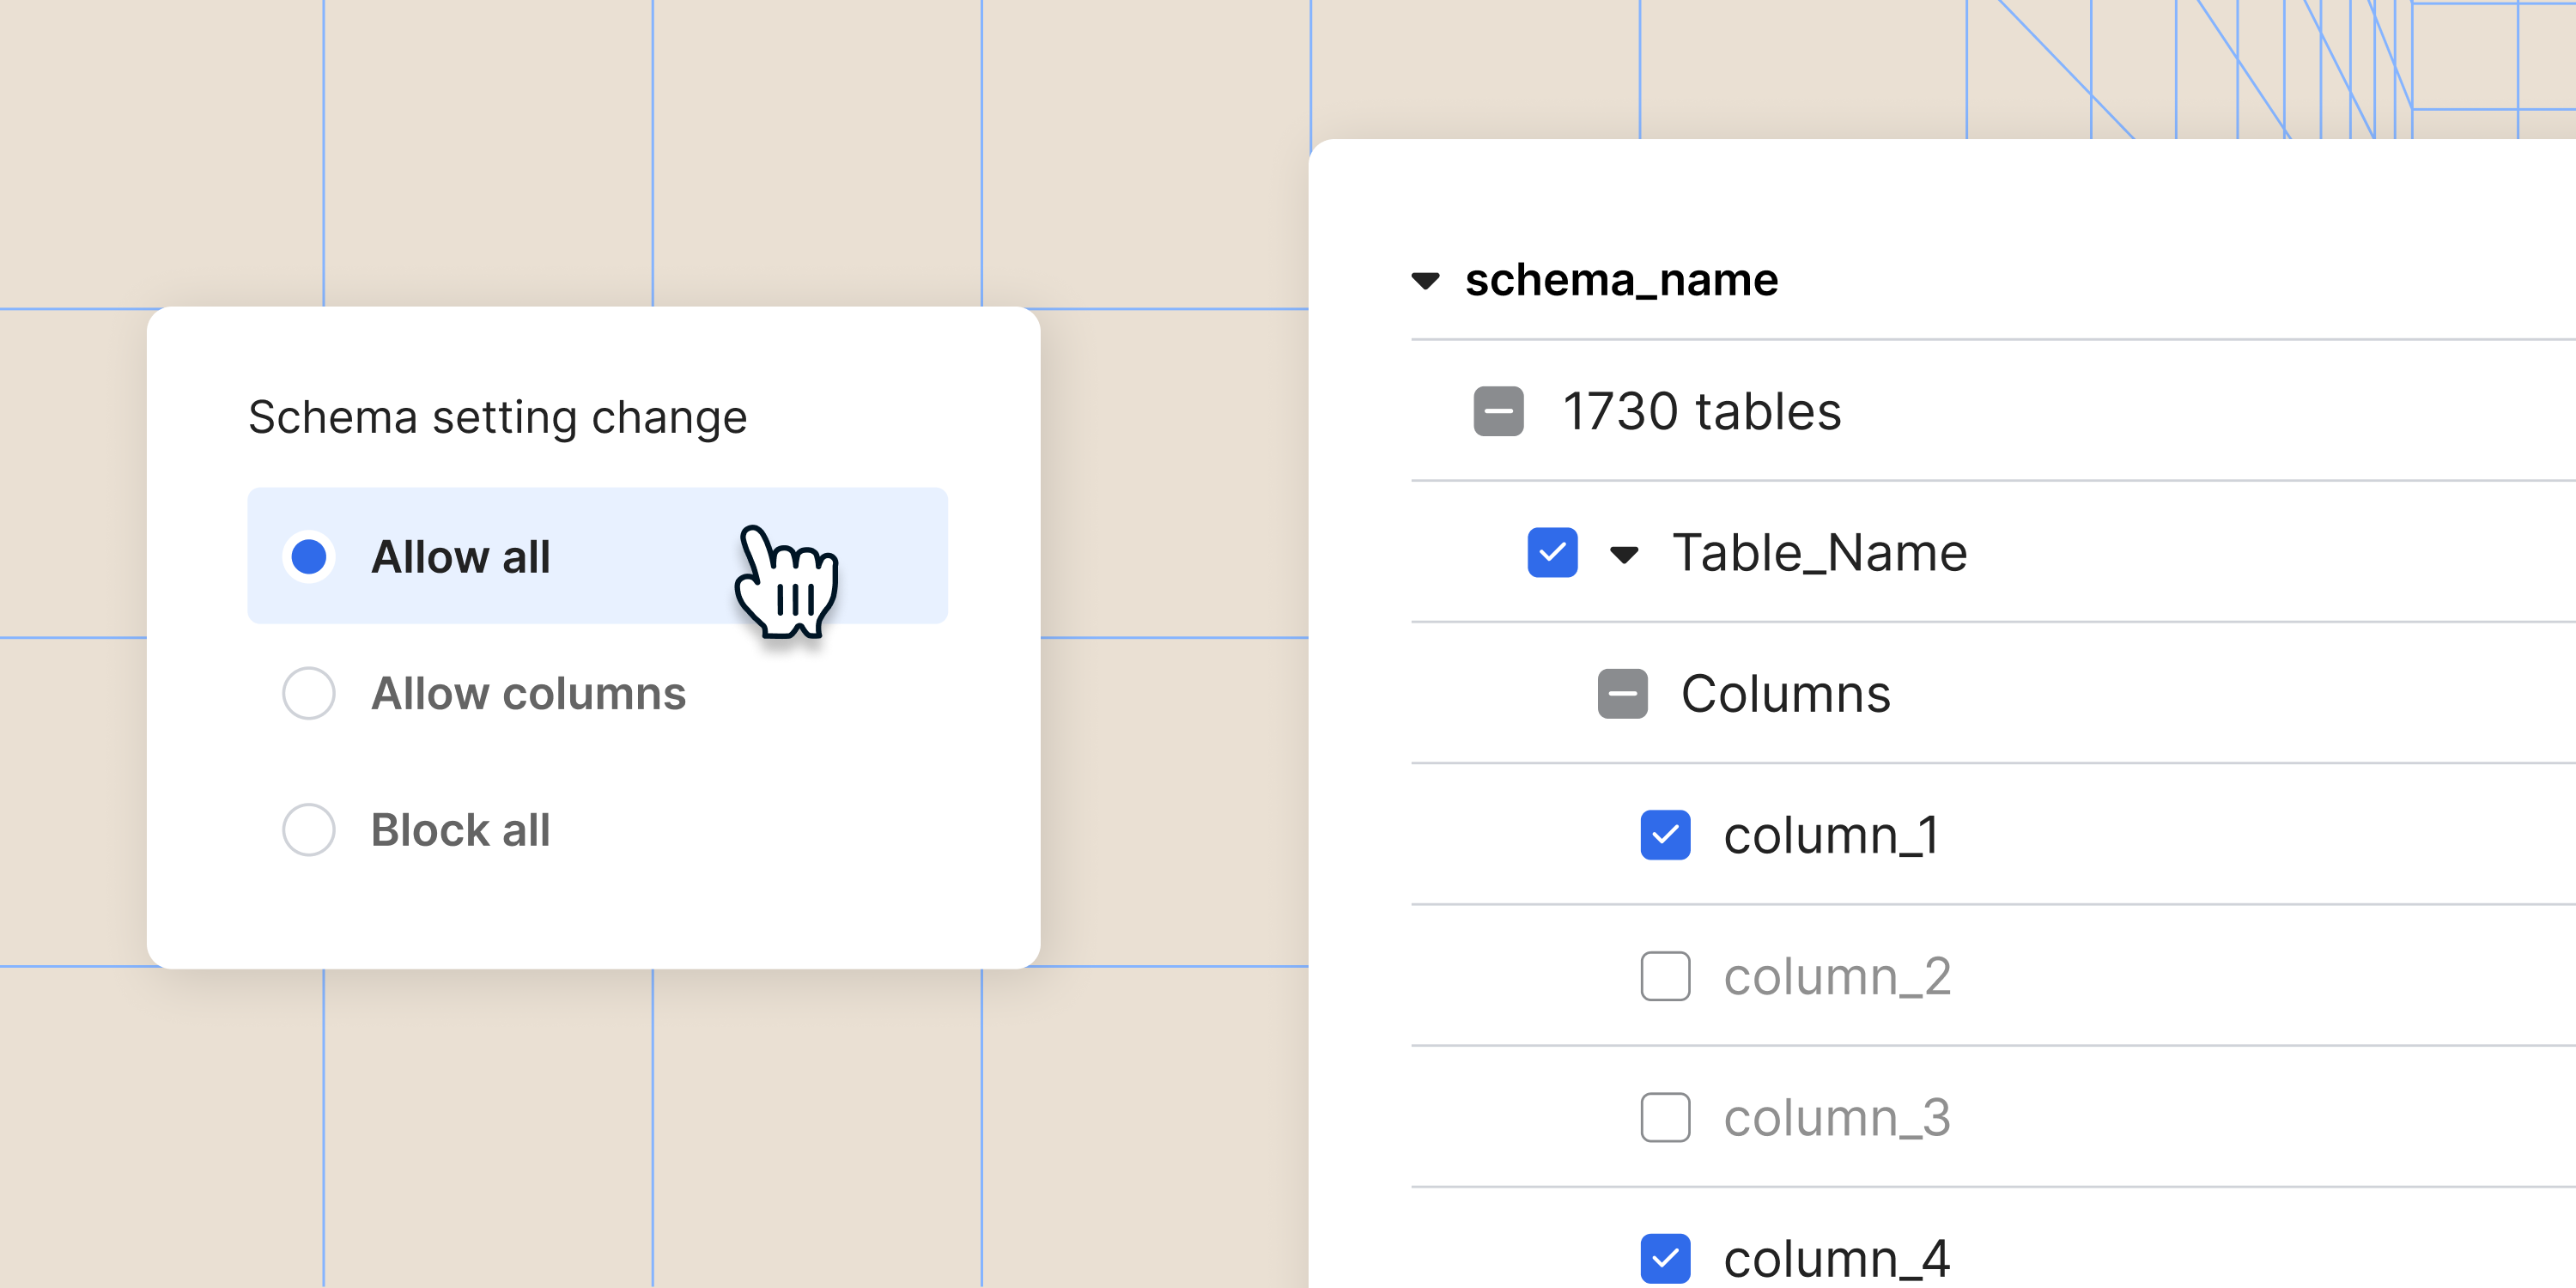
Intro to role-based access control (RBAC)

Video
03:31
How to control your costs and set up alerts

Video
02:16
Monitor your account: View and query Fivetran logs in your destination

Video
02:37
Monitor your account: How to add the free Fivetran Platform Connector

Video
07:27
Syncing strategies
Video
4:06
How to optimize your Fivetran Transformations spend
Video
04:13
How to set up transformations

Video
3:35
How to use Fivetran's in-product annual contract purchase flow

Video
09:10
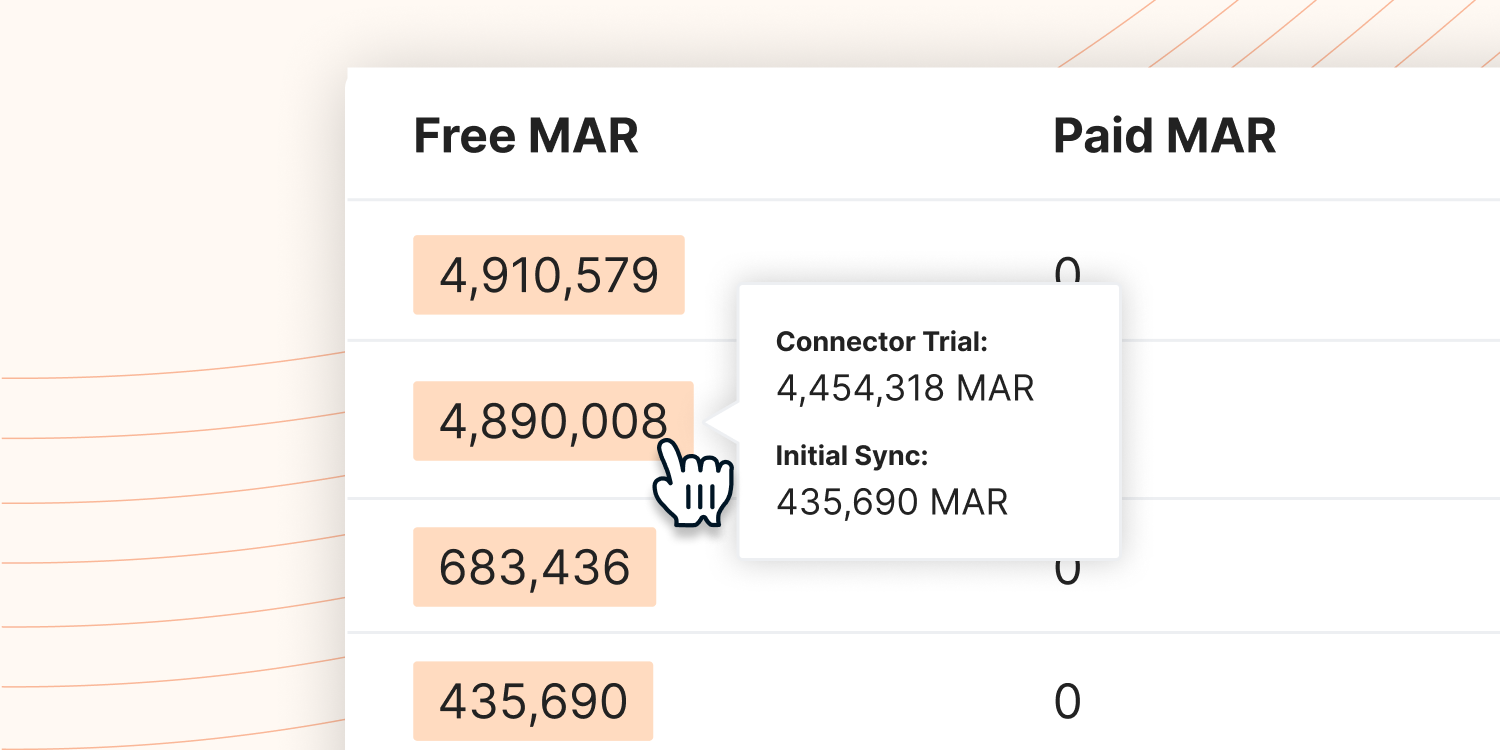
Understand pricing: Monthly Active Rows explained

Video
3:55
How to get the most out of Fivetran's pricing estimator

Video
05:35
14-Day Connector Trials

Video
08:00
How to set up a connector

Video
04:02
How to set up a destination

Video
05:11