How AI changed performance engineering (2 years later)
%20(1).png)


By early 2025 we had been through the easy 2x, the hard 2x, and the extremely hard remainder. The work was a reminder that engineering that extra “nine” of reliability or performance comes at an increasing cost. Thankfully, we met every OKR from our previous effort. The obvious bottlenecks were gone; the flame graphs had flattened out. The prevailing view on the team (my view included) was that the lemon had no more juice in it. What remained were long-tail wins of a few percent each, and the honest question was whether any of them were worth an engineer's quarter.
That view was wrong, but not for the reason you'd expect. The remaining ideas were still small. What changed is that the cost of evaluating an idea collapsed, and once evaluation is nearly free, a long tail of 5% wins becomes a perfectly good business.
Here is the shape of the old economics. Before AI, trying out a performance idea was genuinely painful. You spent two or three days pulling production logs, reading old commits to understand why some piece of code was written the way it was, and standing up a local test — only to discover the gain was 1% or 2%. Because that up-front cost was so high, we routinely dropped good ideas. Not because we thought they were bad, but because we couldn't tell in advance whether they were good, and finding out cost three days.
That is a filter on cheap-to-evaluate ideas, not on high-value ideas. It was silently biasing our roadmap for years and we didn't have a name for it.
[CTA_MODULE]
What actually changed
Bringing AI into the team's daily workflow changed four things concretely:
Context gathering stopped costing days
Thanks to the information retrieval and synthesis capabilities of AI, what took two to three days of manual log digging and code reading now takes a few hours. This is the whole ballgame. Everything below is a consequence of it.
We size the impact before writing code
We can analyze production logs to determine how many connections would actually benefit from a change before touching the codebase. "If this works, what fraction of production gets faster?" used to be a question we answered after the fact, or not at all.
We can proactively analyze hot paths
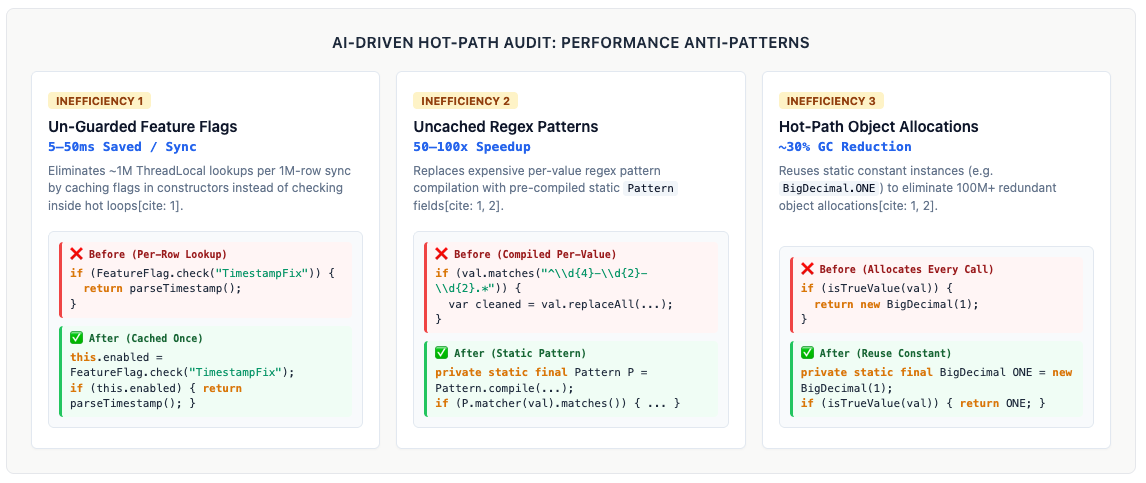
Our core row-processing and column-processing loops are O(N×M) — a small constant factor matters enormously. AI static analysis over those loops catches subtle anti-patterns that sampling profilers miss entirely: a redundant object conversion, a missing cache, an allocation inside the inner loop.
Prototypes and tools got cheap enough to be disposable
Local POCs and JMH microbenchmarks run in hours, not days. And at the extreme end, we built entire operational tools with coding agents without dedicating an engineer to the project.
The real change: gathering and sifting material we couldn't before
The biggest change is more subtle than "AI writes code faster."
Performance engineering in a large distributed system is, mostly, a problem with parsing evidence. The answer to "why is this slow" is almost always sitting in material you already have: production logs across thousands of connections, a five-year commit history, four layers of retry logic across three abstractions, a week of fleet telemetry. The evidence exists but nobody has the hours to read it.
So when we started on this journey, we didn't read it. We sampled it. We looked at one connection instead of a thousand, read the current code instead of its history, profiled one benchmark instead of analyzing the fleet. Then we reasoned from the sample and were sometimes right.
AI removed the sampling step. We now routinely read all of it, and the difference is not incremental. It’s a revolutionary change in how many questions we can ask.
Concretely, this reorganized our work around five pillars.
Pillar 1: Codebase archaeology and deep walkthroughs
In a complex pipeline, the hard part is rarely writing the fix; it's understanding how everything talks to everything, and why some legacy code was written that way years ago. AI goes through commits, PR descriptions, and code paths and explains the picture. It takes everything into account and doesn’t miss a step or a fact. These are examples of esoteric facts which were relevant to our performance work that AI was able to dig up:
- GitHub missing table guards.Tracing execution flow across
GithubIssuePullRequestUpdaterandGithubUpdaterrevealed thatapi.pullRequest()andupdateUsers()fired unconditionally — fetching full details even when the customer had deselected those tables. - GitHub deployment status history. Synthesizing old commit history showed the deployment status checks were written in 2021, before we had incremental cursors. That explained why 57,000+ API calls per sync were firing with zero state tracking. The code wasn't wrong when it was written; the platform grew a capability underneath it and nobody went back.
- Resumable GCS upload retries. Walking a four-layer retry stack —
GcsStorageClient→RetriableInputStream→CloudSpecificPutApi→ theGCS SDK— pinpointed the exact line whereUploadPacketInputStream.restart()wiped session state and restarted a 250 MB+ upload from byte zero. - HybridHash decoupling. Reviewing correctness gates against actual conditions showed HybridHash was blocked on
isParallelProcessing()unnecessarily, even where standard writers could handle it safely with direct-write.
Note the pattern in all four: none of these are exotic algorithmic insights. They are all "this code does something nobody intended, for a reason that made sense once." That class of bug is pervasively common, enormously valuable to fix, and almost impossible to find by reading code at human speed.
Pillar 2: Proactive hot-path and anti-pattern analysis
In December 2025, we ran AI static analysis across our core row and column processing loops, looking specifically for micro-inefficiencies that standard profilers don't surface. We implemented three to four core performance fixes directly out of that audit. We have not yet turned the remainder into a formal backlog, and the audit will likely need a fresh pass to make sure it hasn't gone stale — but it proved the technique: AI static analysis finds non-obvious hot-path bottlenecks.
Pillar 3: Log mining, and sizing the opportunity first
Before any optimization work, answer the question: if this idea works, how much production traffic actually gets faster? This is the pillar that changed our prioritization most. Log mining doesn’t have to be a huge token burn, either. We’ve developed techniques for AI to write code to pre-process our logs into a more manageable, lower-token bundle for another model to process. These are both platform and connector specific improvements, part of the long tail of improvement identification that AI now enables:
- GitHub deployment status quota waste. Parsing production logs proved that deployment status calls consumed more than 90% of the total hourly API quota — roughly 57,000 to 59,000 calls per sync — while fetching zero new changes. That gave us complete confidence to build the watermark fix.
- Bloom filter fleet sizing. Analyzing a full week of production fleet data proved that 98% of external-sort cost occurs during incremental syncs, and that memory was not the constraint. That result saved us from a memory auto-tuning project and pointed us at CPU cache optimization instead. This is the highest-value kind of finding: the one that stops you from doing months of the wrong work.
- Pipeline idle time. Mining logs across thousands of connections showed downstream process and load workers sitting idle, waiting for full table extractions or global flushes.
- Okta requests sizing. Log analysis showed 39 of 178 Okta connections (~22%) had more than 1,000 users, which established that parallelizing user queries was worth roughly a 15% sync duration drop across that fleet.
- Incident investigation. Regressions in complex performance health metrics used to take several days of manual log digging to localize. It's now a few hours.
Pillar 4: Fast prototyping and microbenchmarking
Performance ideas are cheap; verifying them is what costs. Spinning up local test harnesses and microbenchmarks in hours means we verify before we commit engineering time. Improvements that fast prototyping helped accelerate:
- Cache-blocked split-block Bloom filter. JMH microbenchmarks proved that aligning Bloom filter bits to CPU cache lines yields a 2.5x to 4.8x speedup on low-level add and probe operations — before touching core code at all.
- Packet compression V3. A test harness running 1 TB Postgres to BigQuery showed the move from Snappy/AES-CBC to Zstd/AES-GCM giving +8.2% row throughput and -7.6% runtime.
- Resumable GCS uploads. A retry test script proved that resuming from the last committed chunk saves up to 250 MB of re-upload on a 256 MB packet during a network drop.
Pillar 5: Custom AI diagnostic skills and AI-built automation
Rather than using AI only for ad-hoc chat, we packaged our diagnostic procedures as reusable skills and pointed coding agents at whole projects.
- GitHub connection profiling skill. We built a custom Claude skill that, given a connection, fetches sync logs, summarizes every API call made, identifies latency and error patterns, and pinpoints the major inefficiencies. Running it across many connections gave us fleet-wide usage patterns and let us prioritize for maximum impact. The important shift here is that a diagnostic procedure stopped being tribal knowledge in one engineer's head and became an artifact anyone can run. Having AI match the code to the metrics and not overlooking any data points was a big boost to our ability to profile.
- The OTD regression detection bot, built end to end by AI. We had an operational gap: subtle On-Time Delivery (OTD) regressions, at the service level and for VIP accounts, were going undetected. This system runs daily, scans for >4% OTD drops across services and VIP accounts, auto-assigns Jira tickets to owning teams, dispatches Slack digests with the top five impacted connections, and auto-resolves tickets when performance recovers.
That last one deserves emphasis for engineering leaders specifically. The bot was not on the roadmap, because it would have cost an engineer for a quarter and the roadmap slot was worth more spent on the engine. "Zero-headcount execution" is a genuinely new option in project selection, and it applies exactly to the useful-but-never-quite-prioritized tier of work that every team has a list of.
What it added up to
The projects that came out of the AI era are not small.
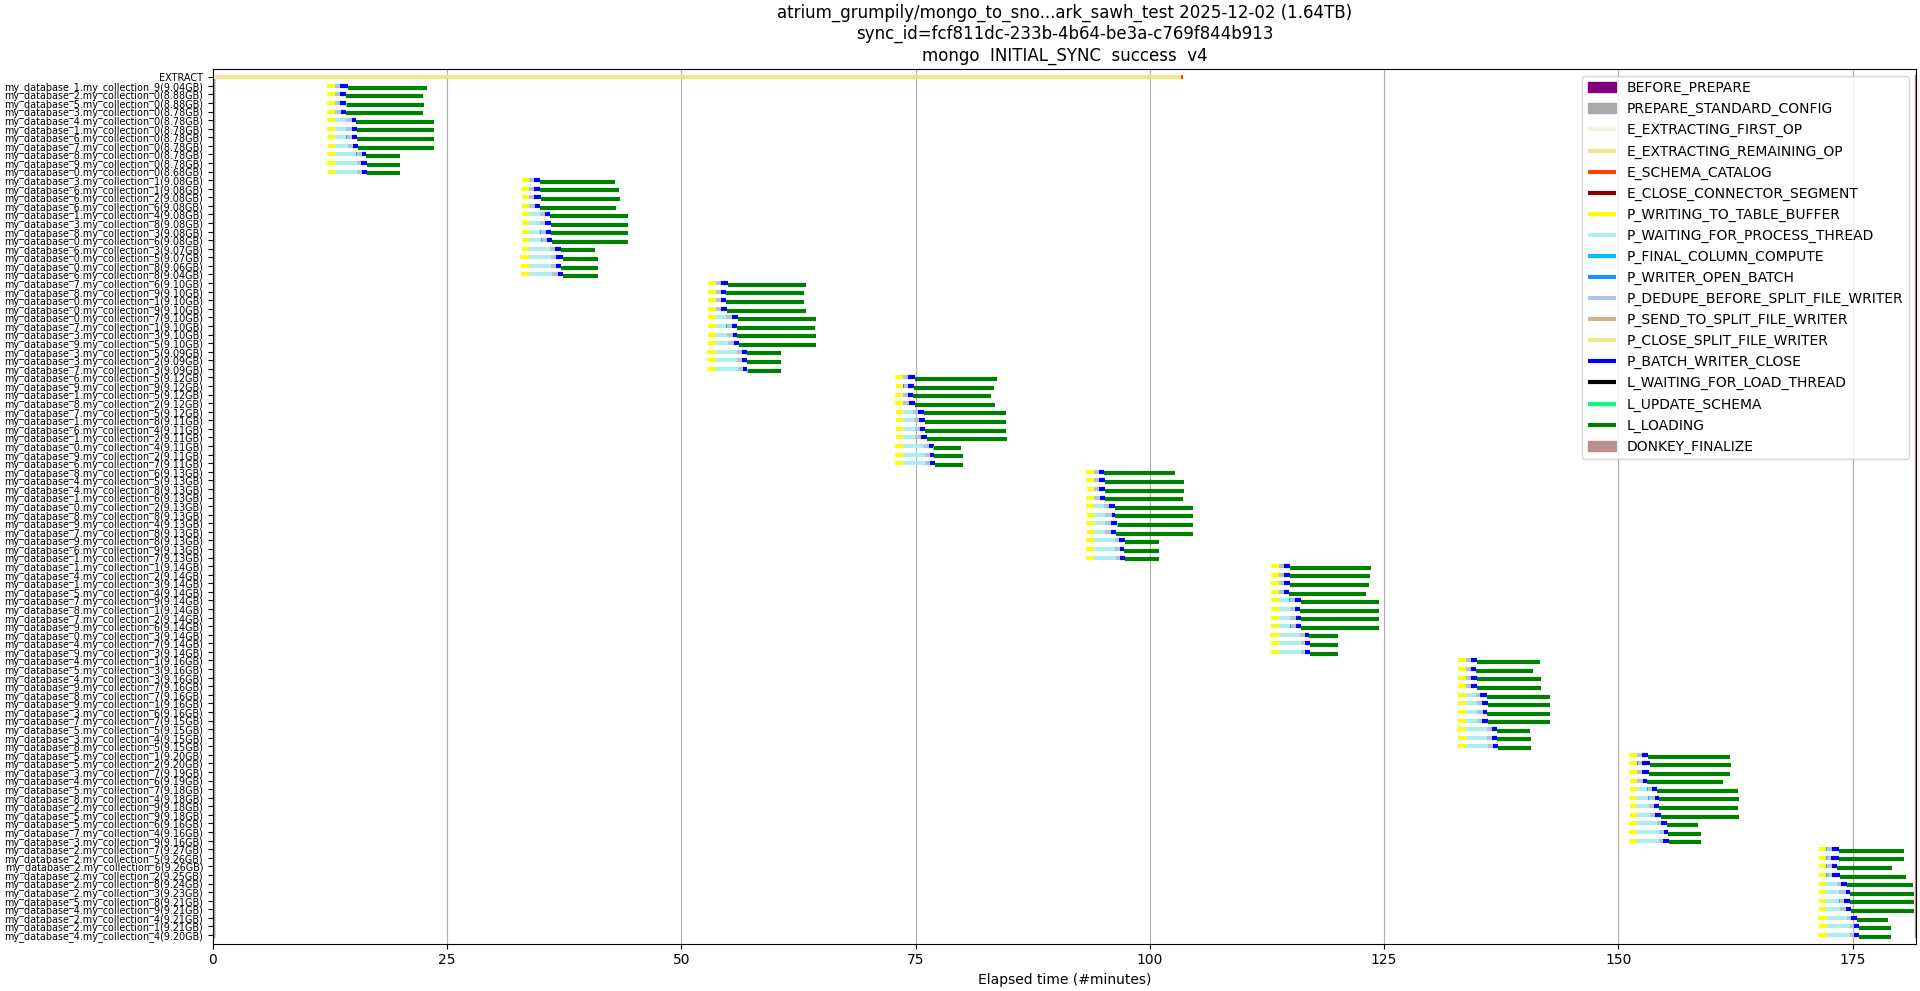
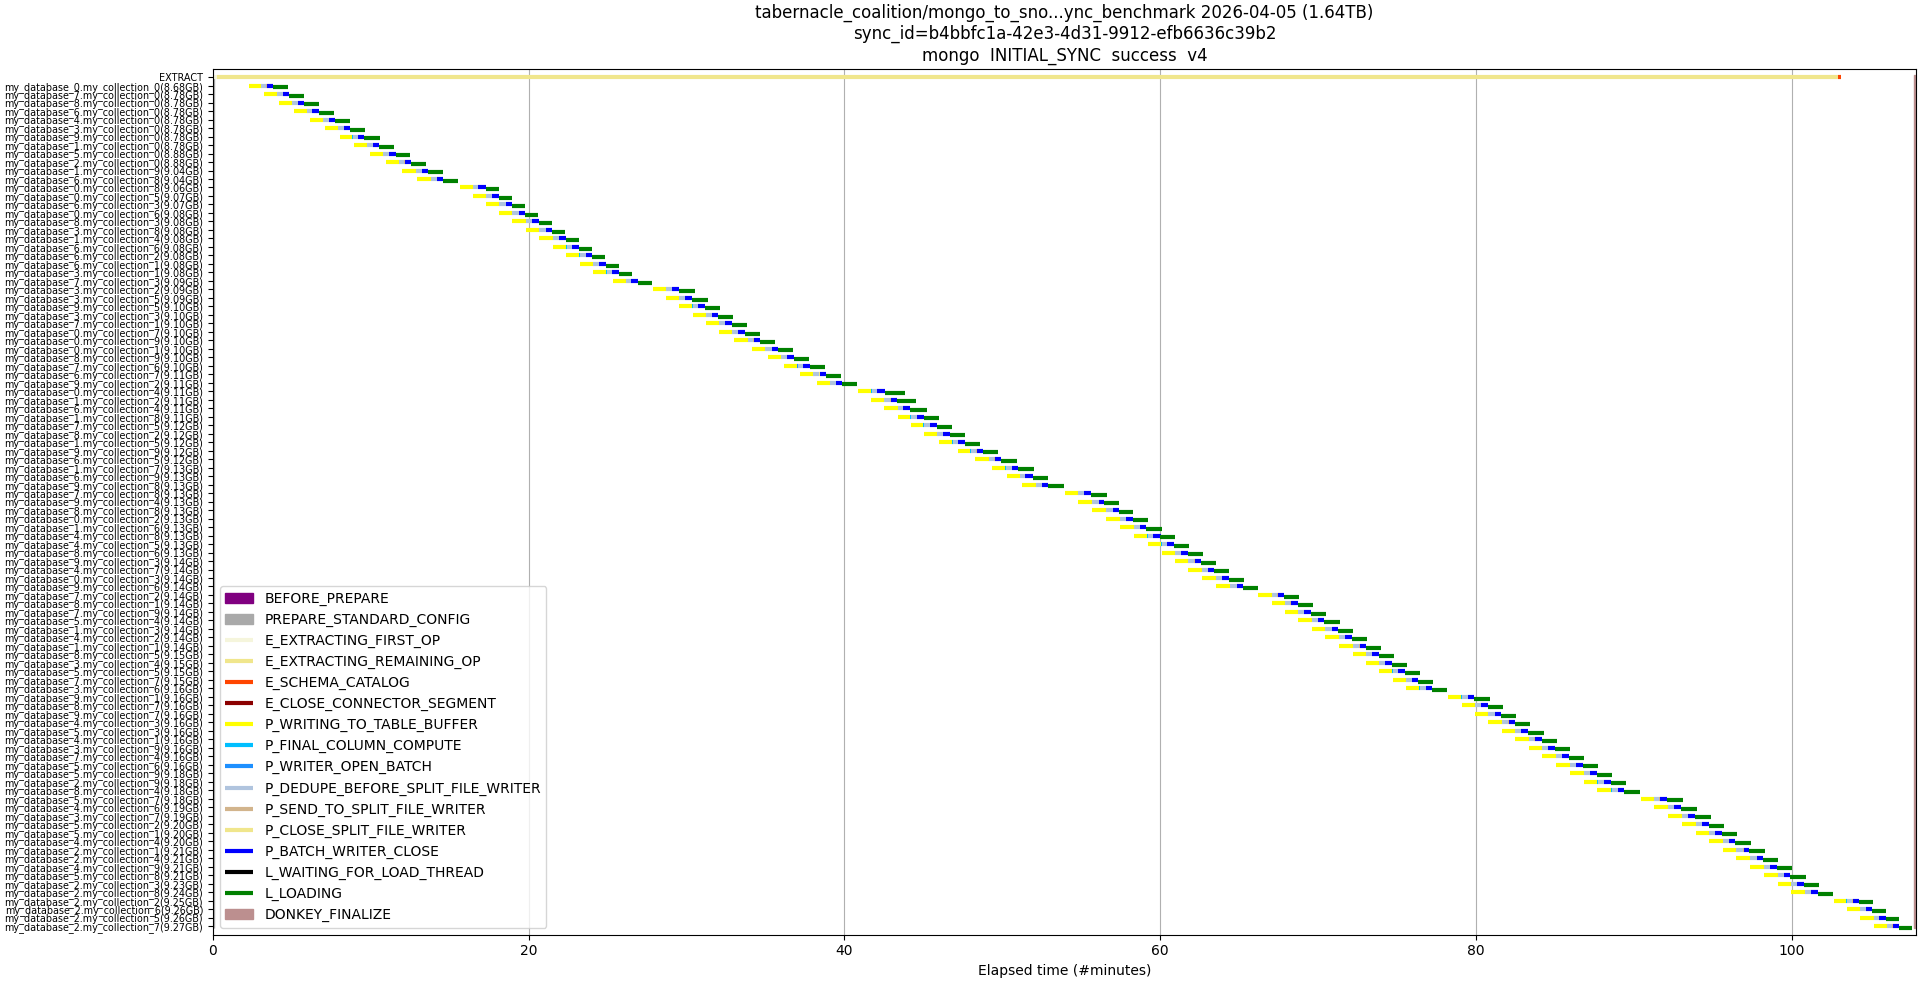
BATCH_COMPLETE signaling
We eliminated resource idle time by triggering table process and load tasks asynchronously as soon as each table's extraction completes, rather than waiting for the whole sync or a global flush. This meant pipeline parallelization instead of global stalls, creating up to 70% improvement in import throughput in benchmarks and up to 47% in certain production connections. We’ve implemented six services so far, all applicable to any connector service with high table counts.
SAP HANA connector
We built a series of connector-side and core optimizations — DateTime, UTF-8, and BigDecimal deserialization, asynchronous BATCH_COMPLETE signaling, SplitFileWriter and import parallelization, ResultSet tuning — and roughly doubled initial sync benchmark import throughput, with 35-40% throughput improvement observed on production initial and incremental syncs.
GitHub connector
Analysis of production connection logs and API usage patterns let us eliminate redundant calls and prevent rate-limit bottlenecks: table-selection guards, listing page sizes raised from 30 to 100, and custom mechanisms to extract incremental changes even where the REST API has no native support — including an empirical updated_at watermark filter for deployment statuses. On high-volume connections this eliminated more than 90% of total API calls, and dropped sync durations by up to 35% on average for the biggest-impact changes.
Smaller targeted work, now worth doing because sizing it is cheap, includes parallelized Okta user queries (15% reduction in full-sync duration for the 22% of connections with >1,000 users) and parallelized Kustomer per-table permission checks (31% faster fetchStandardConfig across nearly all Kustomer connectors).
Changes to behavior in-flight include adaptive deduplication with HybridHash enabled on non-parallel split writers; the cache-aligned split-block Bloom filter (3.8x-4.8x on Bloom operations at 10M-50M elements); Zstd/AES-GCM packet compression (an estimated 4-5% cut in overall initial sync runtime with no peak CPU increase); SplitFileWriter parallelization for all destinations, including the Parquet-writer destinations previously blocked over OOM concerns that our analysis showed were safe; and resumable GCS packet uploads.
Tooling improvements include:
- Moving on-demand profiling of production connections to a guardrailed CLI command that triggers Java profiling in Temporal against a specific connection, service type, or sync type with fractional sampling.
- An OTD regression bot, plus automated benchmark failure and regression detection.
What we learned: an AI-powered reference for your own performance work
Our list from part 1 still holds. This second list includes capabilities we would have wished for two years ago:
- Size the opportunity before you write a line of code. Ask, "If this works, what fraction of production gets faster?" and answer it using logs and code, not intuition. A change that helps 3% of connections and a change that helps 60% look identical on a whiteboard.
- Mine the whole fleet, not a sample. Sampling was never a methodological choice; it was a budget constraint. When reading everything costs hours instead of weeks, read everything. One week of full fleet telemetry answered a question that a year of spot-checking hadn't.
- Treat a negative sizing result as a win. Proving that memory was not our deduplication constraint killed a memory auto-tuning project before it started and redirected us to CPU cache work. The finding that stops you from doing months of wrong work is worth more than most findings that start something.
- Do archaeology, not just code reading. Point AI at commit history and PR descriptions, and ask why the code looks like this. Our most valuable finds were all the same shape: code that made sense when written, and quietly stopped making sense when the platform grew a capability underneath it.
- Trace multi-layer stacks end to end. Retry logic, buffering, and error handling spread across four abstractions are exactly where bugs hide from both profilers and reviewers, because no single file looks wrong. Ask for the full path and the specific line.
- Interrogate the guards, not just the algorithms. Some of our easiest wins were correctness gates that were stricter than they needed to be. Ask "what conditions does this check actually require?" separate from "is this check correct?"
- Run static analysis over your hot loops on purpose, periodically. Profilers show you where time goes; they don't show you the redundant object conversion or the allocation inside the inner loop that shouldn't be there at all. In an O(N×M) path, constant factors are the whole game.
- Microbenchmark before you integrate. Prove the mechanism in isolation — we validated a 2.5x-4.8x gain on Bloom filter operations before touching core code. If the mechanism doesn't win in isolation, it will not win in the system.
- Build a throwaway harness for whatever you can't microbenchmark. Whether failure-path behavior, network drops, or retry semantics, write the disposable script that demonstrates the waste. It is now cheap enough to be worth it for a single question.
- Package repeated diagnostics as skills, not prompts. The moment you run the same investigation twice, make it an artifact. A diagnostic that lives in one engineer's head scales to one engineer; a skill scales to the team and can be run across the whole fleet.
- Use agents for the work you'd never staff. The tooling you keep deciding not to prioritize — monitors, digests, and regression detectors — is now buildable without spending a roadmap slot. Keep a list of that tier of work; it's suddenly a backlog rather than a wishlist.
- Re-run your audits; findings go stale. An audit is a snapshot of a moving codebase. Ours needed a fresh pass, and we knew that when we ran it. The cost to audit code has dropped dramatically with AI, so it’s worth doing.
- Verify everything against the measurement infrastructure from Part 1. AI output is a hypothesis, not a result. Every claim above became real only when a benchmark confirmed it and the Benchmark Improvement Record explained it. Without the measurement infrastructure in place (and being trusted by the team), AI analysis doesn’t provide much benefit.
- Keep prioritization human. AI collapsed the cost of evaluating ideas. It did not decide which 5% win is worth a quarter, which customer's problem matters most, or when to stop. A seasoned engineer’s judgment is worth it.
The lesson
The lesson isn't "AI made us faster at writing code." We were never bottlenecked on writing code.
We were bottlenecked on knowing which code to write. Every practice in Part 1 — the metric, the instrumentation, the benchmarks, and the improvement record — exists to answer that question, and each one is a way of making evidence cheap enough to act on. AI is the same kind of tool, applied to the evidence we already had but could never afford to read.
Which means the two halves of this story are not really separate. The reason AI has been so productive for us is that we spent two years building the measurement infrastructure that makes its answers checkable. We spent two years building performance engineering practices that make our team effective at accelerating Fivetran. An agent that mines production logs is only useful if the right metrics exist and are trustworthy. A microbenchmark result is only actionable if there's a benchmark suite to validate it against and a record to write it down. A hot-path audit only converts into shipped throughput if there's a permanent team with a queue and a roadmap to take it on.
If you're starting from zero, don't start with the AI. Start with the metric.
For further reading about Fivetran’s engineering operations, try:
Fivetran has also published publicly available benchmarks.
[CTA_MODULE]
Related blog posts
Start for free
Join the thousands of companies using Fivetran to centralize and transform their data.