Fivetran formulas: Increase your Return on Ad Spend (ROAS)

Marketing teams will spend approximately 14 percent of a company’s budget in 2023, which is up nearly four percent in the last two years1. With more spend and more campaigns, comes more data — and an increased responsibility to leverage that data.
To understand what ad campaigns are working - and importantly, what’s not working - one of the most critical metrics that your marketing team requires is Return on Ad Spend (ROAS). As a data engineer, you’re the key that unlocks advertising data for your organization.
With that responsibility on your shoulders, let’s dive into a formula that helps you deliver accurate, automated data to your marketing colleagues.
What is Return on Ad Spend (ROAS)?
Return on Ad Spend (ROAS) measures the revenue generated from an advertising campaign relative to its cost.
In short, a high ROAS means you’re acquiring a higher number of customers at a cheaper cost and a low ROAS means you’re acquiring a lower number of customers at an expensive cost.
Your marketing team uses this metric to determine which channels and campaigns to spend more or less money on to increase customer acquisition for your organization.
Why centralize advertising data?
Your marketing team can’t get to an accurate, reliable ROAS metric without the help of their data team.
Without the support of a data team, marketers at data immature organizations are forced to manually pull numbers from siloed spreadsheets and sources themselves, often leading to error-prone reporting and bad business decisions. Organizations higher up the data maturity curve ensure this type of crucial data is validated and automated by the data team.
As a data engineer, your biggest challenge in executing this project is figuring out how to build and maintain the pipelines with the correct endpoints to provide your data analysts the necessary metrics to query.
Building and maintaining these pipelines is costly, in both time and money, due to lost efficiency in fixing broken pipelines and managing API changes (which unsurprisingly, is a constant for marketing data sources).
Fivetran simplifies the setup and maintenance by providing fully-managed, pre-built connectors.
Let’s walk through the common data sources, Fivetran connector setup, popular tables and available transformations. These are the first steps to accelerating your advertising insights and becoming your marketing team’s data superhero.
What type of connectors are applicable?
There are two primary data source types for this project: Advertising and Conversion.
Reminder: Fivetran has over 300+ connectors. So if you don’t see one of your sources on this list, we likely still have it — and if we don’t, you can request a Lite Connector.
Advertising data
- Your organization likely uses three to eight advertising platforms.
- The advertising data sources may differ depending on if you are a B2B or B2C business, but the data from these platforms will provide valuable insights into the campaign performance and reach.
Commonly used advertising platforms:
B2B:
- Google Ads
- LinkedIn Ads
- Microsoft Ads
- Campaign Manager
- The Trade Desk
B2C:
- Facebook Ads
- TikTok Ads
- Snapchat Ads
- Reddit Ads
- Twitter Ads
Conversion data:
- Your organization likely uses one application or database for your conversions. The type of platform used depends on your organization’s business model.
- The data from these platforms will provide insights into actual conversions and outcomes resulting from your campaigns.
Commonly used conversion sources based on company sales type:
B2B (contracts, sign-ups, etc.) are likely using a CRM system (customer relationship management)
- Salesforce
- Microsoft Dynamics 365
- Zoho CRM
- Zendesk Sales
- Gainsight
B2C (purchases/subscriptions) are likely using a POS system (Point of sale)
- Shopify
- Stripe
- Squire
- Zuora
- Magento
More complicated sales types are likely using an ERP system (Enterprise resource planning)
- Netsuite
- Oracle Fusion
- SAP
- Anaplan
- Microsoft Dynamics
To find out which platforms your company uses, consult with your marketing team and ensure we have a Fivetran connector by exploring availability here.
How to setup a Fivetran connector for understanding ROAS
Let’s walk through the steps to enable a connector. We will use Facebook Ads as an example. You will follow similar steps for the other necessary data sources your organization uses.
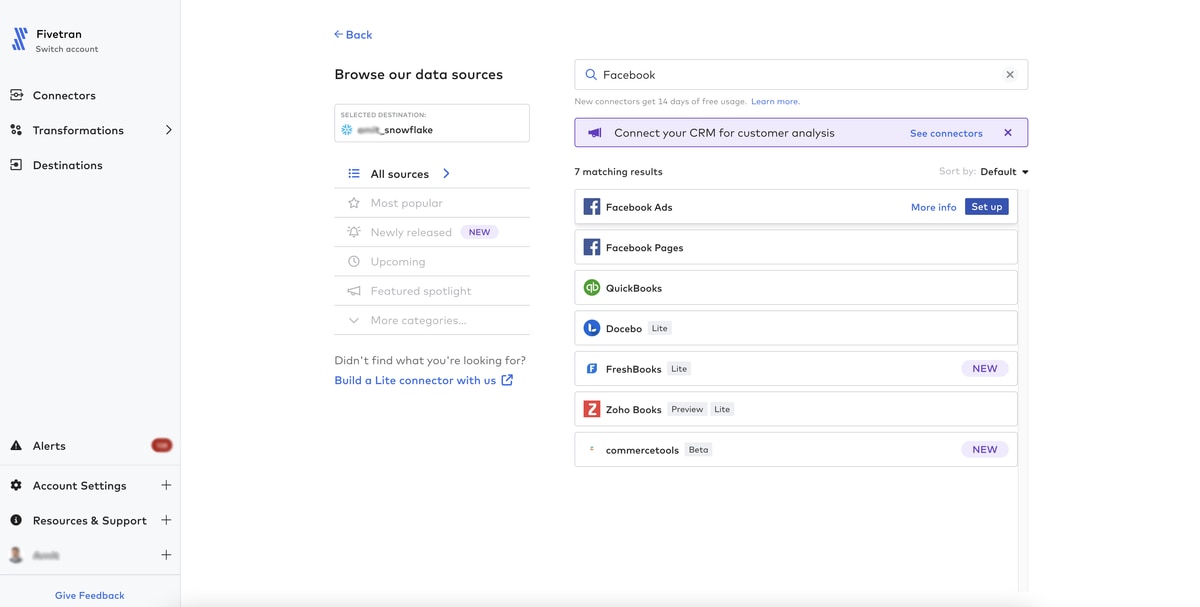
Step 1 - Add connector:
Search for Facebook Ads in the dashboard and click Continue Setup.
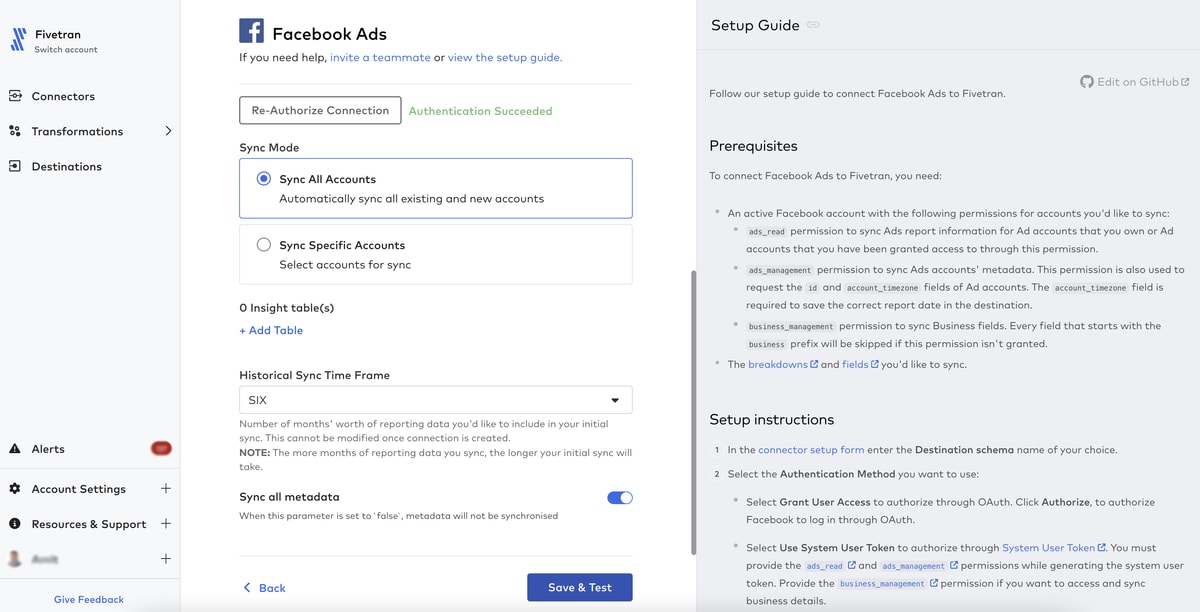
Step 2 - Authorize API:
Ensure you have appropriate access to all the campaigns and accounts. Use an Admin account where possible. Input a Destination Schema and Authorize API.

Step 3 - Configure data and Select Historical timeframe:
You will have a few options to select on how you want to configure the data.
- Schema-Based: Review the schemas within the Entity Relationship Diagram (ERD) to understand which tables contain data on campaigns, ad group, ad history and more.
- Report-based: Select “+ Add Table” to use a pre-built report template to get the fundamental data required for this type of analysis.
For example the the ACTION_CONVERSION_DEVICE table will provide an aggregate view of ACTIONS_FIELDS like WEBSITE_PURCHASE_ROAS and MOBILE_APP_PURCHASE_ROAS broken out by device type. You can also build custom reports
When selecting a "historical timeframe", choose a recent time frame in order to speed up the historical sync and get to insights quicker. Then click Save & Test.
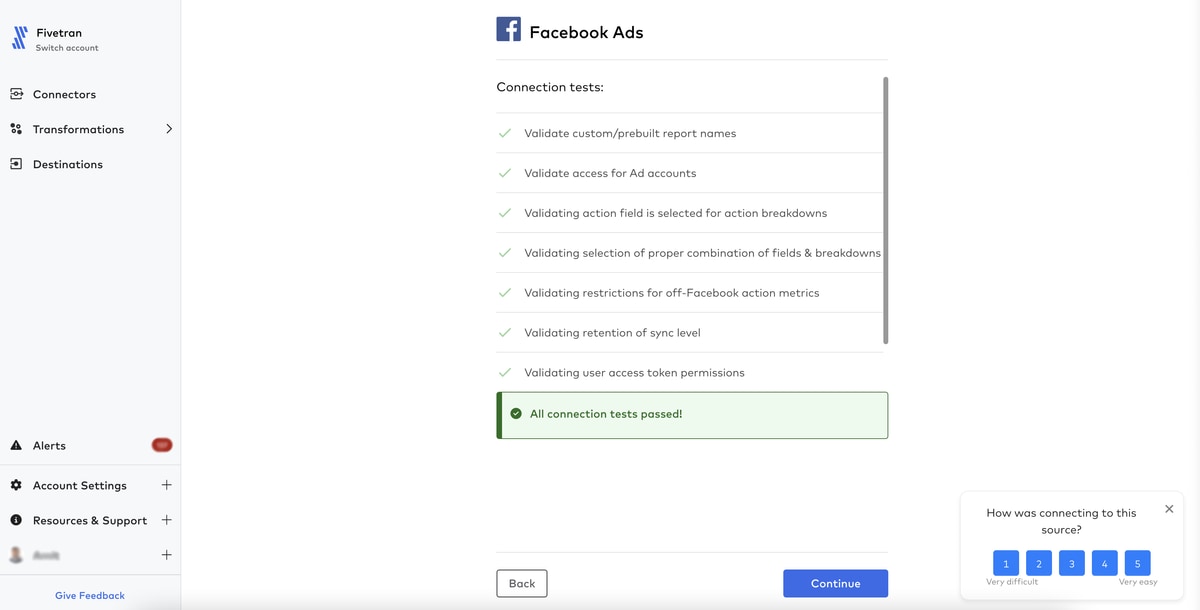
Step 4 - Connection tests:
After Fivetran completes a series of connection tests, select “Continue".
Step 5 - Start Initial Sync:
The first historical sync that Fivetran does for a connector is called the initial sync. During the historical sync, we extract and process all the historical data from the selected tables in the source.

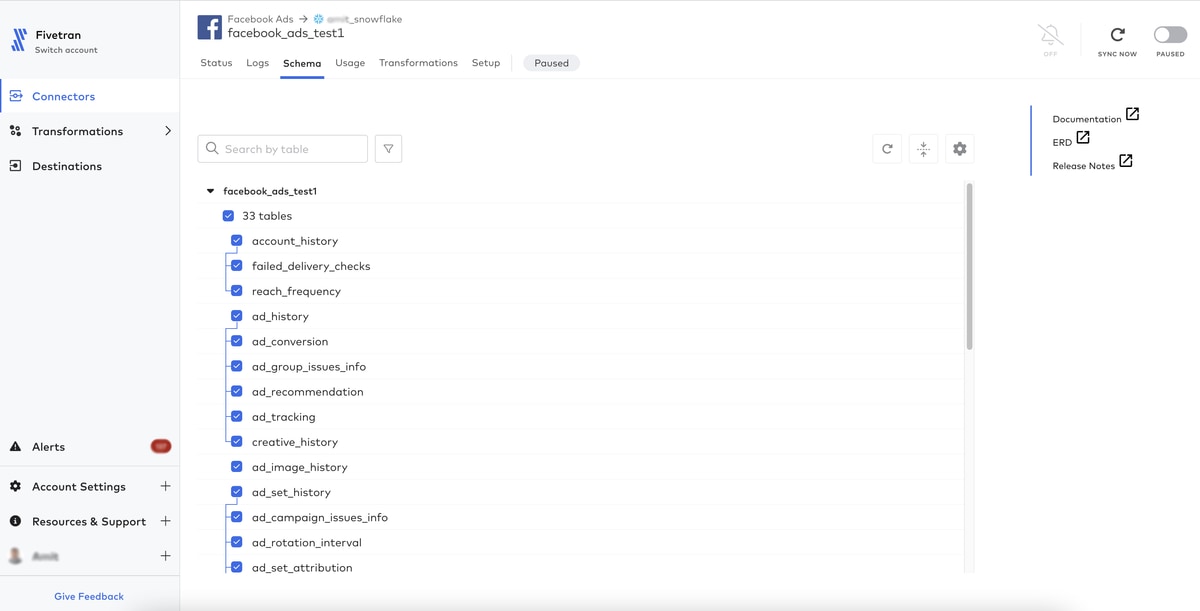
Under the Schema tab, you can select/deselect which tables you would like to sync.
Step 6 - Validate:
Validate and standardize data across each new source in the destination.
Transformations for advertising and conversion data
After your data has been ingested into your cloud based destination, leverage our Quickstart data models to efficiently and automatically turn raw application data into analytics-ready tables.
Doing so avoids the need to build your own dbt project and has no impact on your consumption.
Let’s transform Account, Campaign and Ads data into analytics ready tables for Impressions, Engagement and Performance.
Step 7 - Quickstart data models:
1) Navigate to the Transformation tab and either click “Get started” > “Quickstart transformation” if you’re starting from scratch or “Add transformation” > “Quickstart transformation” if you have existing dbt transformations (which you can continue to use in parallel).
2) Configure your Quickstart transformation: You only need to make three choices:
a) The data source: Facebook Ads
b) the connector with the data you want to transform: Facebook_Ads
c) and the orchestration schedule, which we recommend “fully integrated” so you automate model runs with connector loads, decreasing data latency and computational costs
3) Now you have the analytics-ready data in your destination. Turn that data into visualizations, reports, business intelligence or ad-hoc analysis.
Bonus: You can also integrate your own dbt project to orchestrate and manage custom data models or free Fivetran data models that are not yet available via Quickstart transformations.
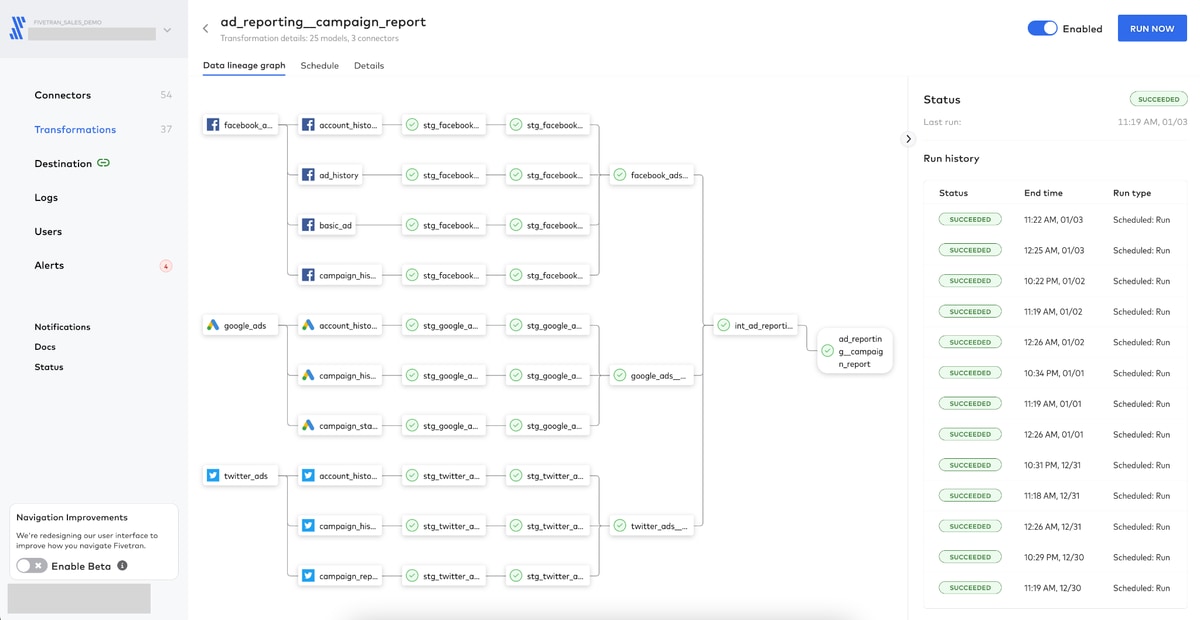
As previously mentioned, your organization is likely using multiple advertising platforms and want to know what’s working and when. Leverage the Ad Reporting Data Model to roll up the data from your ads across your various channels to get a clear picture of daily spend, impressions and clicks.
Simply add the data model to your dbt project, integrate your Git repo into Fivetran, and then orchestrate, visualize and manage the entire pipeline right from the platform.
Last step
Step 8 - Uncover Insights
After connecting your ad sources, connect your conversion sources so you can compare campaign advertising spend data with conversion metrics to understand what is driving customers to convert (purchase, sign-up, sign a contract, etc.)
How Popsockets doubled its ROAS with Fivetran
Founded in 2014, PopSockets has sold over 230 million of its iconic phone grips in 75 countries.
As PopSockets experienced massive growth and increased its paid marketing efforts (Google Ads, Bing Ads, Facebook Ads and more) Fivetran became a key solution in helping them centralize data and build models to uncover deeper insights — without having to grow its engineering team.
Prior to Fivetran, PopSockets was struggling with reporting efficiencies and communicating insights cross-functionally due to operating in data silos. After adopting Fivetran and Snowflake, Popsockets centralized their disparate data and built models to uncover deeper insights — without having to grow its engineering team.
“By combining data across Salesforce Commerce Cloud, our ERP system and all ad platforms [with Fivetran], we've built a model that allows us to diagnose daily profitability and quickly shift spend across product categories and strategic initiatives. Layering in our COGS and fulfillment rates empowers us to understand true profitability, especially across product lines.” — Kyle Chu, Sr. Business Intelligence Analyst
Fivetran enabled PopSockets to centralize their data, save hours of effort and double their return on ad spend — all while scaling worldwide.
Are you ready to do the same?
[CTA_MODULE]
If you’re already a Fivetran customer, visit your dashboard and start connecting today. Don’t forget, you get a 14 day free trial on every new connector!
1 - https://blog.hubspot.com/marketing/marketing-budget-percentage
Related blog posts
Start for free
Join the thousands of companies using Fivetran to centralize and transform their data.


