9 Best data analytics tools of 2023

Real-time insights, KPI dashboards, and automated reporting are key components of many data analytics tools today, driving better decisions and business efficiency.
Without the right tool, organizations will find it difficult to effectively manage the increasing amount of data they create, process, and store across cloud data warehouses, marketing tools, and countless other systems. Poor data management can skew behavioral insights and reporting, misguide marketing efforts, and negatively impact customer experiences.
Data analytics tools offer a solution by streamlining data analysis, tracking, and processing workflows. They help teams predict outcomes more consistently, target campaigns more precisely, and realize the business's full potential. Whether you’re using Google Analytics or setting up a custom data fabric, the right platform can accelerate decision-making.
This article compares nine of the top data analytics tools, highlighting their key strengths and limitations and discussing factors you should consider when selecting one for your business. We’ll also explain how automated data movement can simplify data analysis and improve overall business efficiency.
What is a data analytics tool?
A data analytics tool helps teams collect, clean, store, and analyze data so they can spot trends, analyze data, review performance, and make informed decisions.
Analytics tools are usually split in 4 main categories based on what they do:
- Collection: This is the first step in any data analytics process. It involves gathering datafrom applications, databases, data lakes, and other source systems.
- Cleaning and preparation: The raw data must be prepared for later use. This requires removing errors, duplicates, and inconsistencies.
- Storage: This involves housing data in target databases, warehouses, or cloud platforms.
- Analysis: The process of applying statistical, mathematical, or machine learning methods to the prepared data to derive insights, discover correlations, and patterns.
Analytics tools may perform one, some, or all of the stages above. For instance, automated data ingestion and integration tools focus on the collection stage, while vizualization tools and BI platforms help teams interpret trends and make decisions in the analysis stage.
The “best” tool depends on what your team needs from it.
Top 9 data analytics tools
Below is a list of 9 of the top data analytics platforms on the market. We’ve listed their features and pricing so that you can decide which one is best for your needs.
1. Fivetran
Fivetran is an automated data movement platform that helps teams quickly integrate their legacy systems and existing business processes with minimal overhead. Its high-performance pipelines automate data ingestion from multiple sources into a centralized data warehouse.
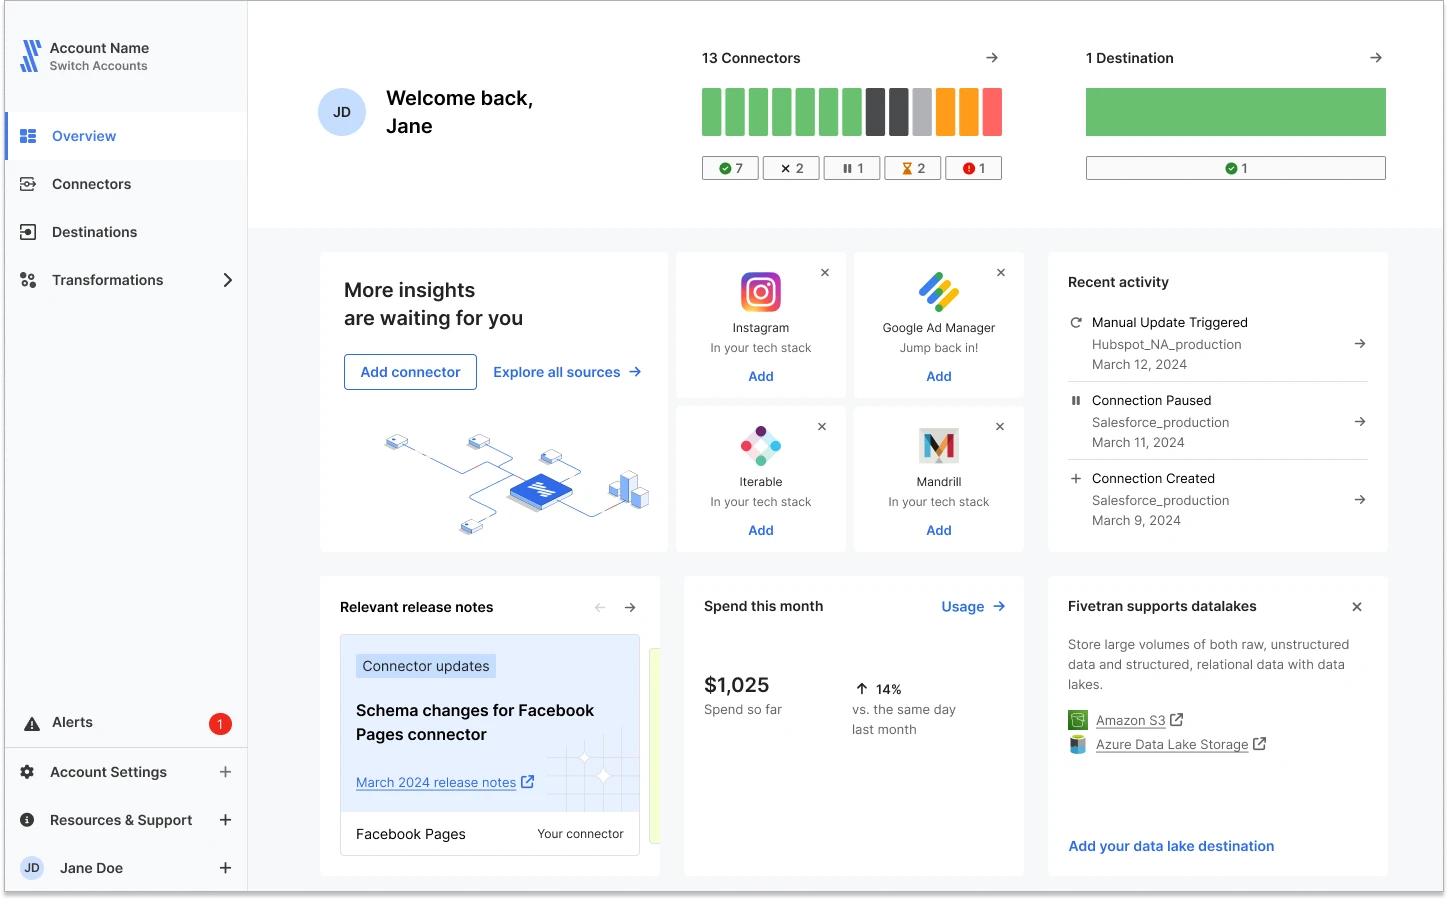
Since they’re fully managed, Fivetran’s pipelines eliminate the need for manual data extraction, loading, and synchronization.
Fivetran’s key strengths
- An extensive library of 700+ pre-built connectors to popular databases, SaaS applications, cloud platforms, data storage systems, and other third-party tools.
- Highly scalable architecture can automatically adapt in real-time to handle increasing data volumes, schema drift, and other evolving business needs.
- Data encryption, both at rest and in transit, GDPR and SOC 2 Type II compliance, and role-based access control (RBAC).
- Fully managed pipelines eliminate the need to manually extract and synchronize data and avoid much of the overhead costs normally associated with building pipelines in house.
Fivetran’s limitations
- Supports basic transformations but requires downstream transformation layers (such as dbt) for complex logic and joins.
- Operates on a micro-batch model and isn’t ideal for ultra-low latency use cases (e.g., live personalization, fraud detection, etc.).
2. Microsoft Power BI
Microsoft Power BI transforms raw data into interactive visual reports and dashboards, aiding KPI tracking and data-driven decisions. Its integration with Microsoft products improves collaboration, performance monitoring, trend spotting, and data sharing.
Microsoft Power BI’s key strengths
- Interactive visualizations present visual stories, allowing users to drill down further into the details to uncover hidden patterns and explore data dynamically.
- With Microsoft ecosystem integration, Power BI leverages the existing infrastructure and familiarity of products to facilitate widespread adoption.
- Advanced AI (like Azure machine learning and natural language processing) identifies patterns and predicts outcomes more accurately than humans.
Microsoft Power BI’s limitations
- Steep learning curve for complex data modeling and other advanced features.
- Limited customization; coding or third-party add-ons are necessary to overcome these customization constraints.
- Struggles when handling large or complex data sets, imposing specific workspace constraints such as limitations for dataflows in shared capacities (non-Premium capacities).
- Power BI’s cloud dependency (and licenses) for sharing dashboards across teams can be a hurdle for businesses with strict on-premise policies.
Pricing options start from $9.99 per user/month and may vary by country. They also offer a free trial.
3. Tableau
Tableau transforms complex datasets, especially from multiple sources, into visually rich and interactive dashboards. This data visualization lends itself to intuitive analysis for both technical and non-technical users.
Tableau’s key strengths
- Complex visualizations and interactive dashboards.
- Real-time, customizable, location-based reports with visual spatial data and comprehensive geographic data analysis.
- Versatile data connectors that provide broad connectivity to numerous data sources, like flat files, SQL databases, and cloud storage.
- Enterprise-grade Tableau Server and Tableau Online enhance Tableau's performance and scalability, facilitating global deployments.
Tableau’s limitations
- Expensive compared to other data analytics tools like Power BI, mainly because of its enterprise-tiered licensing and advanced features.
- Lacks strong data preparation tools for complex ETL, requiring users to rely on other platforms for data cleaning and transformation.
- Struggles with big data environments, particularly when it comes to real-time data analysis.
- Performance strain with large datasets means such operations must be paired with high-performance databases or optimized queries to overcome dashboard crashes.
Tableau has a versatile pricing plan depending on the size and needs of your team.
4. Qlik Sense
Qlik Sense is a data analytics tool built for self-service interactive data exploration from multiple data sources. It enables data-driven decisions, particularly among ordinary business users rather than IT teams, across an organization’s departments, like finance, sales, and marketing.
Qlik Sense’s key strengths
- Unlike traditional query-based models, its associative engine allows users to make dynamic associations that reveal hidden insights and relationships.
- Its self-service capabilities have democratized insights as users no longer have to depend on IT teams to build their own dashboards and reports.
- The tool scales well, thanks to its in-memory engine.
- Native support for data modeling with QlikView Scripting (QVS)
Qlik Sense’s limitations
- Expensive for large teams and is also expensive for smaller businesses with limited budgets.
- Resource-intensive
- Limited integrations
- Lacks sharing and collaboration features
Pricing is different for different user groups. Check out the details here.
5. Sisense
Sisense is ideal for businesses that embed advanced analytics and interactive dashboards into their workflow, apps, and products. It is valuable for brands that want to enhance their customer-facing products with self-service analytics and in-built dashboards that don’t require users to switch platforms or settings.
Sisense’s key strengths
- An advanced data visualization tool with an in-chip and in-memory engine to transform complex data into interactive dashboards.
- Flexible deployment options, from cloud, on-premise, and hybrid models. It also provides containerization technologies for deployment with Docker and Kubernetes.
- Granular access control mechanisms and strong encryption
Sisense’s limitations
- Better suited for large organizations due to plugin and scalability costs, disadvantaging smaller teams.
- Embedding is strong but lacks deep customization beyond superficial theming, requiring extensive coding and developer resources.
- Performance degrades with large datasets, necessitating hardware tuning and efficient data modeling.
- Limited support for unstructured data types adds to data preparation burdens and restricts use cases.
Pricing is available on request.
6. Looker
Looker centralizes business intelligence, standardizing metrics for a single source of truth. It offers strong governance by embedding self-service into workflows and customer-facing applications.
Looker’s key strengths
- Centralizes data processing with LookML, ensuring data governance and enabling self-service analytics without SQL.
- It leverages Google Cloud's advanced AI/ML for automated, AI-powered workflows and integrates Google's AI services.
- Provides enterprise-grade security through role-based permissions and granular access controls.
Looker’s limitations
- Steep learning curve
- API calls and queries have a 5,000-row limit and 5-minute timeout, with similar limitations on data downloads.
- Data blending is limited to 5 sources
- Limited integrations
Pricing is available on request and is free for nonprofits and educators.
7. SAS
SAS is an advanced statistical data analysis tool for complex statistical modeling. It excels at high-volume data management, data cleaning, transformation, merging, sorting, and integration activities.
SAS’s key strengths
- Its model outputs are accepted by regulatory bodies like the FDA, making it popular in regulated sectors like healthcare and government.
- Enterprise-level data security, compliance, and data integrity to safeguard sensitive information through strong encryption and stringent access control standards.
- Excels at high-volume data management, data cleaning, transformation, merging, sorting, and integration activities.
SAS’s limitations
- Because SAS is proprietary, it cannot easily be customized for workflows, nor amenable to rapid prototyping.
- Its cost and accessibility make it prohibitive for individuals, small organizations, and academic users.
- Technical restrictions and performance limitations, such as a lack of support for variable-length character data, limit its flexibility in specialized applications.
You’ll have to contact their team for pricing details.
8. Zoho Analytics
Zoho Analytics' target audience is small and mid-sized businesses that require an easy-to-use and affordable business intelligence platform. Zoho lets teams with minimal technical expertise consolidate data from various sources and gain insights quickly.
Zoho Analytics’ key strengths
- Frictionless integration with the Zoho ecosystem and an extensive library of pre-built reports and dashboards.
- Cost-effective and competitive pricing make Zoho Analytics an affordable and accessible solution.
- Real-time collaboration and sharing, with fine-grained access control to facilitate teamwork.
- Minimal coding skills required for Zoho’s user-friendly, drag-and-drop interface.
- Zoho is flexible, supporting users with plenty of deployment options across major cloud platforms.
- With its drag-and-drop interface, it provides self-service business intelligence for non-technical users.
Zoho Analytics’ limitations
- Performance challenges arise when dealing with large or complex datasets.
- Steep learning curve for those unfamiliar with the Zoho ecosystem.
- The per-user pricing subscription model is expensive for larger teams.
Various types of pricing plans for on-prem and cloud that you can check here.
9. Domo
Domo data analytics combines business intelligence, data integration, and collaboration into a unified cloud platform. It also centralizes data from various sources. It is used to build executive-level and company-wide dashboards that provide visibility across the entire organization by creating a single source of truth.
Domo’s key strengths
- All-in-one platform consolidates various tools, reducing complexity and operational overhead.
- Cloud-native architecture is designed to handle growing user bases and large data volumes, making it suitable for businesses of any size.
- Integrated collaboration features and direct messaging within dashboards.
Domo’s limitations
- More expensive than other data analytics platforms, particularly for teams that require premium features.
- Limited customization options make it challenging to create tailored dashboards and reports.
Price is available on request, and there’s an option to try Domo for free.
Speed up your time-to-insight with Fivetran
Whether it's real-time dashboards, automated data movement, or schema drift handling, the various analytics solutions covered above all help teams get more from their data.
When choosing a tool, look for features that align with your team’s workflows, goals, and technical expertise.
For teams that need high-performing data pipelines without the engineering overhead, Fivetran offers fully managed pipelines that automate data movement from over 700 data sources, quickly and reliably.
[CTA_MODULE]
Frequently asked questions (FAQs)
What are the types of data analytics?
The 4 types of data analytics are descriptive (historical), diagnostic (causal), predictive (future-oriented), and prescriptive (action-oriented).
- Descriptive analytics: This answers the “what happened?” question by summarizing past, historical data, events, and trends.
- Diagnostic analytics: Data is analyzed to explain and answer the “why did it happen?” question by digging deeper to find the causes behind past outcomes.
- Predictive analytics: This utilizes statistical models, machine learning, and historical data to figure out “what might happen?” in order to forecast future outcomes.
- Prescriptive analytics: To answer “what should we do?”, prescriptive analytics suggests actions based on available data and optimization models' predictive insights.
What are the benefits of data analytics?
The benefits of data analytics include:
- Improved decision-making by turning raw data into smart, evidence-based insights.
- Efficiencies are achieved by removing bottlenecks and inefficiencies, reducing waste, and leading to cost reduction.
- Enhanced customer understanding from analyzing their behaviour to obtain insights into pain points, preferences, and purchase habits.
- Competitive advantage through leveraging analytics to spot market trends quickly and move faster than competitors.
- Innovation and growth by understanding emerging trends and market gaps.
What are the factors to consider when selecting a data analytics tool?
There are many things to consider when selecting a data analytics tool, including:
- Price structure: Does the cost and pricing structure, whether it’s a monthly or annual subscription, align with your needs and budget? Does the tool offer a free trial period to test the waters? Are there hidden fees for customer support and advanced features?
- Features: Make sure you’re getting virtualization, collaboration, or advanced analytics capabilities you need — whether it’s A/B testing, KPI dashboards, or automated reporting. At the same time, it’s equally important to avoid ending up with a bunch of features and capabilities you don’t need (and the high price tag that’s hard to justify).
- Integration capabilities: In modern computing, no tool is an island. Check whether the tool “plays well with others,” and integrates with your other applications, either directly or through third-party solutions.
- User-friendliness: A data analytics tool should be sophisticated yet easy to use, with uncluttered and smoothly navigable dashboards. Its interface should be intuitive, without requiring too many steps to implement basic actions.
- Scalability: Can it handle changing growth requirements, whether it’s exponential data, more users, or workload, without performance degradation?
- Security: Ensure the tool’s security protocols adhere to the latest cybersecurity best practices. To safeguard data privacy, data must be protected at rest and in transit with an encryption mechanism combined with stringent least-privilege access controls.
- Support & community: Data analytics tools provide access to resources such as documentation and tutorials, along with an active community of developers offering critical support.
Related posts
Start for free
Join the thousands of companies using Fivetran to centralize and transform their data.


