How to A/B test product-led growth in B2B SaaS

From the beginning of Fivetran, we’ve prioritized making our product easy and reliable so that anyone - no matter their technical expertise – can sign up and automate moving data in minutes.
Yet we’ve always had a traditional B2B SaaS sales-led strategy, with skilled sellers guiding customers and driving business for Fivetran. But not all customers have complex use cases, and we hypothesized many could be successful on their own. As Fivetran grows and moves up-market, we wanted to shift resources to high-complexity customers and allow our more savvy and independent users to sign up, experience and buy Fivetran on their own.
Last year, we A/B tested a new, low-touch operating motion. Here’s what we learned:
- Success hinged on a cross-functional team with a growth mindset. Their curiosity, resilience, respect and teamwork allowed us to build, make mistakes, learn and find success.
- The devil was in the details. Processes, rituals, tools and dashboards fostered alignment and shared goals among stakeholders.
- Data de-risked changing our go-to-market (GTM) motion and uncovered ways to make our sales team more efficient.
- Removing sales from a subset of accounts was a significant organizational change that required strong executive sponsorship.
In this article, I’ll share how we used an experiment to make evidence-based decisions to optimize our GTM strategy.
Experiment design
We wanted to ensure that our A/B test would provide us with strong evidence for whatever conclusion followed. Like any well-designed experiment, we needed clear success metrics and a large enough randomized, controlled sample of account sign-ups.
We decided to run this experiment first with small businesses and considered both purchase rate and efficiency. This new product-led cohort meant no sales reps and no discovery calls and relied on the user to initiate action before we would. Even if a product-led cohort had lower purchase rates, it would allow us to reduce the cost of sale and refocus headcount on more complex customers. We determined that if the purchase conversion rate dropped with our product-led cohort, our net margin would still improve as long as the product-led conversion rate performed no worse than 30% of our sales-led cohort.
| Null hypothesis | There is no difference in conversion rates from sign-up to purchase between our traditional sales-led motion (control) and product-led, low-touch motion (v1). |
| Audience | All accounts with 1-200 employees |
| Test allocation | Control: 63% of signups V1: 37% |
| Duration | 5 months |
| Primary success metric | Signup-to-purchase rate |
| Secondary metric | Average revenue per account (ARPA) |
| Minimal detectable effect (MDE) | 30% |
| Statistical power | 80% |
Experiment execution
Establishing a cross-functional growth team
Big shifts to go-to-market strategy are not taken lightly. Throughout this process, executive sponsorship was critical to aligning our leaders, facilitating this change and empowering our teams to execute.
We created a cross-functional tiger team across Marketing, Sales, Operations, Analytics and Product to form our first growth team. Since Fivetran had never been sold without a salesperson before, we needed to identify and fill gaps in product and marketing in the absence of a “guide.” In addition to testing a product-led motion, we also launched dozens of product and marketing experiments to increase conversion rates at every step of the buying journey.
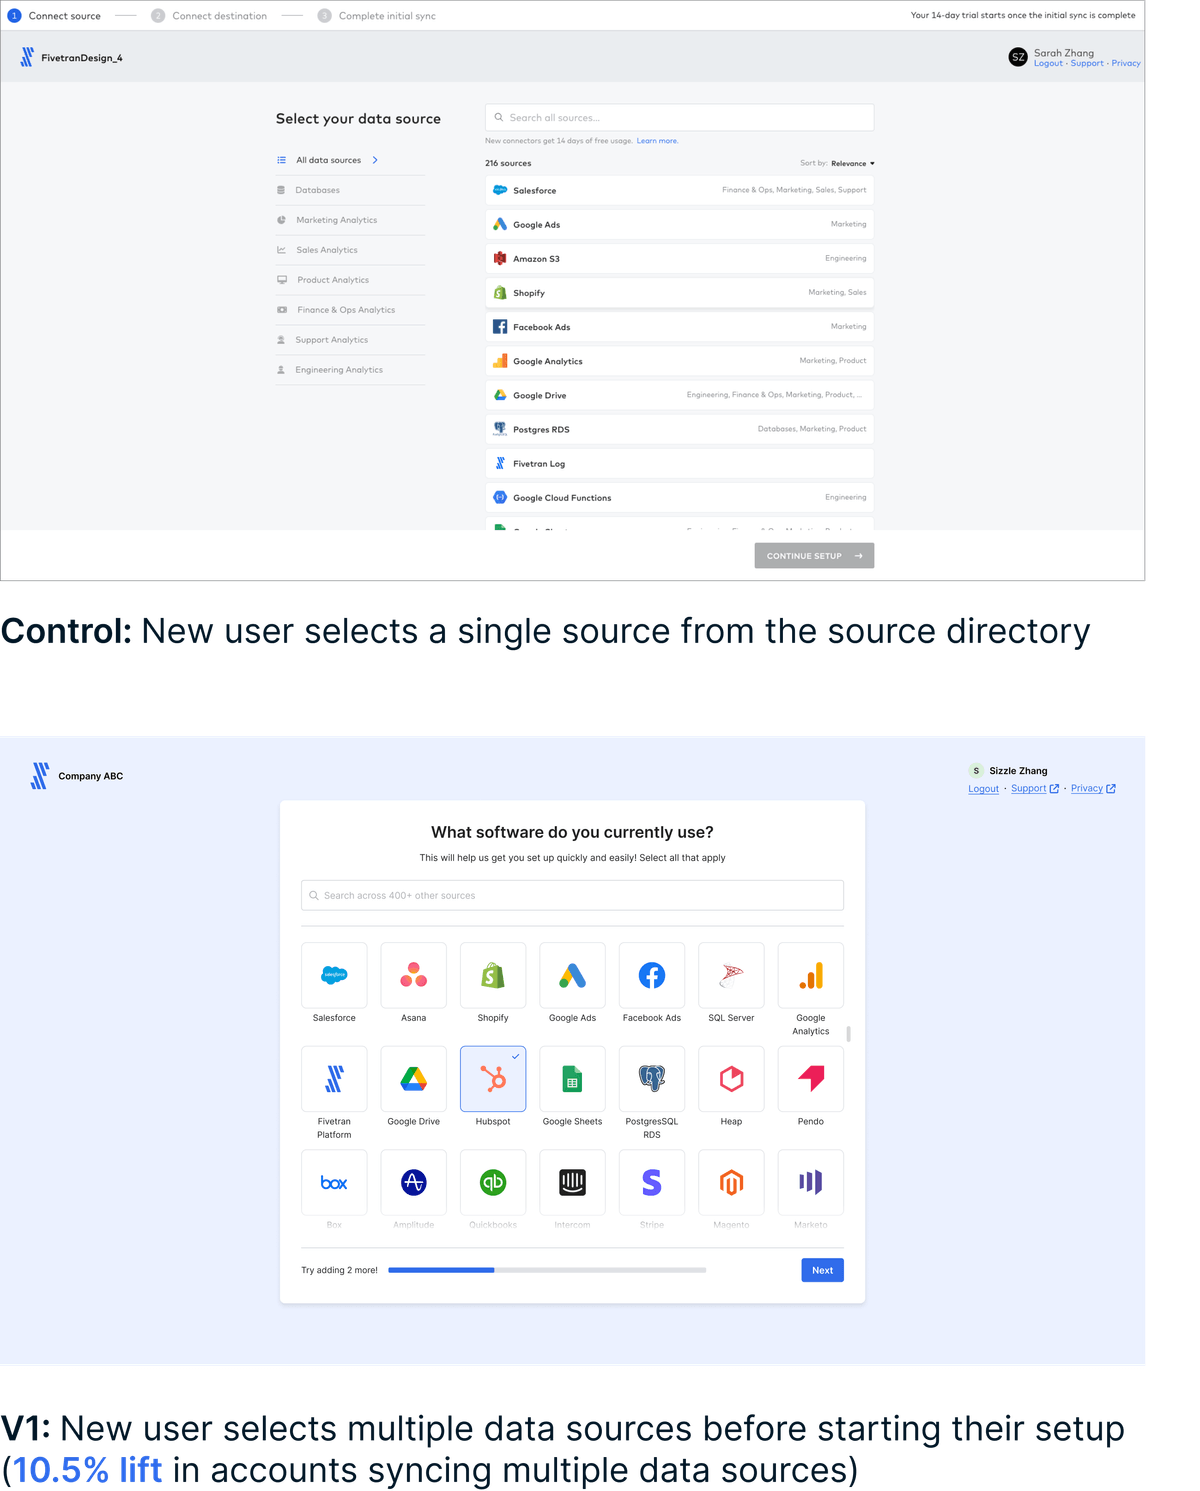
Below is an example of a successful product A/B test that we ran last year. A new sign-up selects multiple data sources to connect (variant) instead of just one (control). We saw a lift in both trial start rates and the number of accounts with multiple connectors.
Evolving our systems
Testing in GTM was unprecedented for Fivetran. This experiment required us to split and bucket accounts within our GTM and routing tools, which required collaboration across many teams, weeks of rebuilding automations and multiple rounds of QA. It took several times to get this right, but we monitored the rollout for weeks and ensured our analysis accounted for any mishaps.
Using product triggers to contact customers and send them to sales
While Fivetran is reasonably easy to use, some product features and connectors can be more complex and signal high potential. Connecting that user with sales would be the best thing for everyone involved. We used quantitative analysis and feedback from sales to create “product triggers'' that identify prospects to transfer to sellers. This is fairly standard in the industry: A “product qualified lead” is generated and routed to sales based on actions the user takes in the product.
Guiding decisions with data rituals
Our analytics team played a critical role in sharing experiment results and helping us deeply understand their findings. They created an experiment dashboard that monitored conversion rates and average revenue per account (ARPA) for both cohorts. Our growth team reviewed this every week, not just to track progress but to ask questions like, “Why are we seeing higher or lower conversion rates?” or “Which accounts are driving higher ARPA in the sales cohort, and why?” These data-led discussions engendered new ideas for experiments and product triggers.
Results
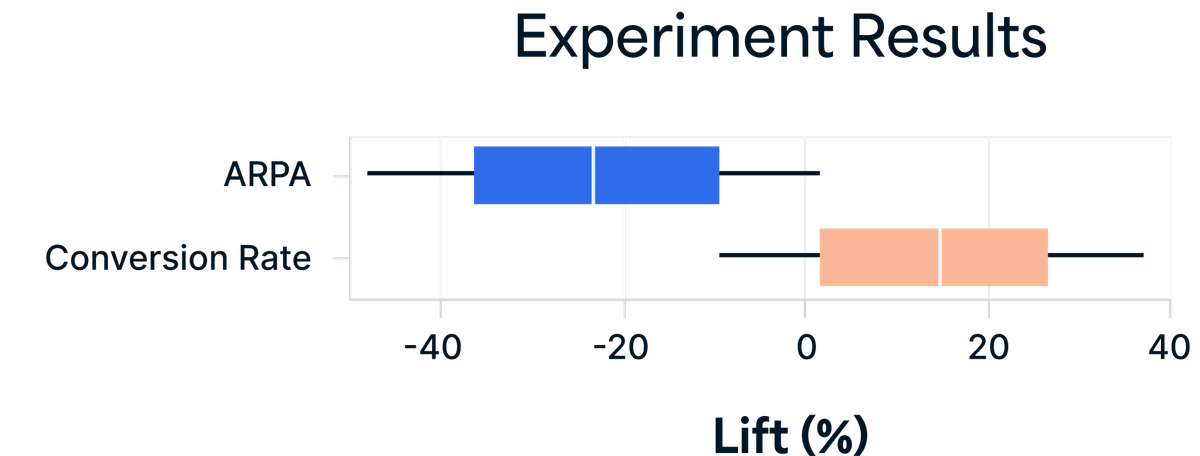
In the end, the product-led cohort did not convert worse than our traditional sales-led motion. Product-led conversion was 14.6% above (95% CI:-8.7% to +37.8%) in the sales-led control cohort. However, the average revenue per account (ARPA) was about 20% lower in the product-led cohort. Given the efficiency savings, this was still a huge win for our team.
What’s next?
We made an evidence-based business decision to expand the product-led motion more broadly in our GTM strategy. Our pilot is now a fully-fledged cross-functional team with revenue targets, just like our sales team.
Now that we’ve established a successful and expanding product-led experience, will we eventually sell without a sales team? We don’t think so – we know the team provides value and we will continue testing new hypotheses in our GTM motion on how to maximize their impact and optimize their time.
[CTA_MODULE]
Related blog posts
Start for free
Join the thousands of companies using Fivetran to centralize and transform their data.


