
Setting Up Snowflake and Fivetran
We have previously covered how to set up Fivetran through Snowflake. From https://www.snowflake.com, you can click “Start for Free” and begin a trial without so much as a credit card number. All you need is your name, company, contact information and a corporate email address. Once your account is created, you will receive an email with a button to activate your account, as well as the server address for your new data warehouse.
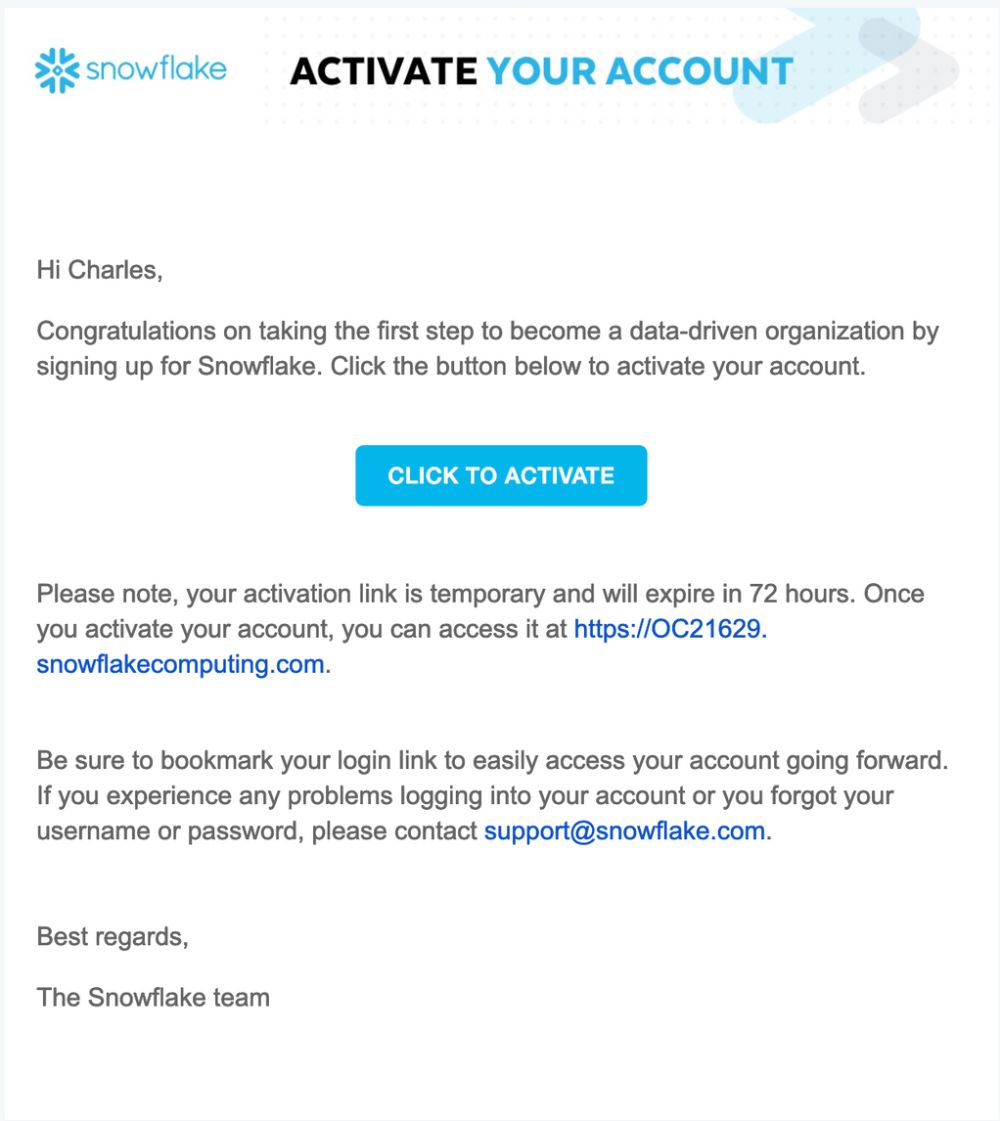
Clicking the activation button will bring you to the Snowflake dashboard. Click “Partner Connect,” and then click on the Fivetran button. A small popup window will show some basic settings and inform you that your name and email address will be forwarded from Snowflake to Fivetran in order to create a Fivetran trial.
Whenever you click the Fivetran button from now on, you will be able to enter the Fivetran UI and set up your connectors. Just supply your credentials as you normally would.
Setting Up Tableau
It’s extremely easy to start a free trial of Tableau. Tableau can be used as both a desktop and cloud app, although at present the desktop app is more capable. A full version will need a license key, which you can purchase or obtain from the appropriate parties in your organization.
To connect Tableau to Snowflake, you will need to download and install prerequisite packages and perform some configuration, depending on your operating system. Note that the default settings for download and installation should work:
For Mac OSX:
- Download and install iODBC. Look for mxkozzzz.dmg
- Download and install ODBC Manager.
- Download and install ODBC Driver. Find the latest version.
- Open ODBC Manager and create a DSN. This is easier than manually writing and editing the files.
For Windows:
- Download and install Visual C++ Redistributable for Visual Studio 2015.
- Download and install ODBC Driver. Find the latest version.
- Use the Windows Data Source Administration Tool to create a DSN.
For Linux:
- Install iODBC or unixODBC from the command line (hey, you asked for it by using Linux).
- Download and unzip the ODBC Driver. The TGZ package will require configuration of the environment; if you downloaded the TGZ package, then configure the environment.
- Configure the ODBC Driver.
- Test the ODBC Driver.
After that, you can enter Tableau’s “Connect” menu and find Snowflake. Enter your Snowflake credentials to connect to your warehouse.

Some Simple Visualizations in Tableau
After connecting to your source, you will find yourself on a screen that allows you to add data sources; you can also select tables by navigating down the hierarchy of warehouse, database and schema to add to your project (called a “Book”) from that source.
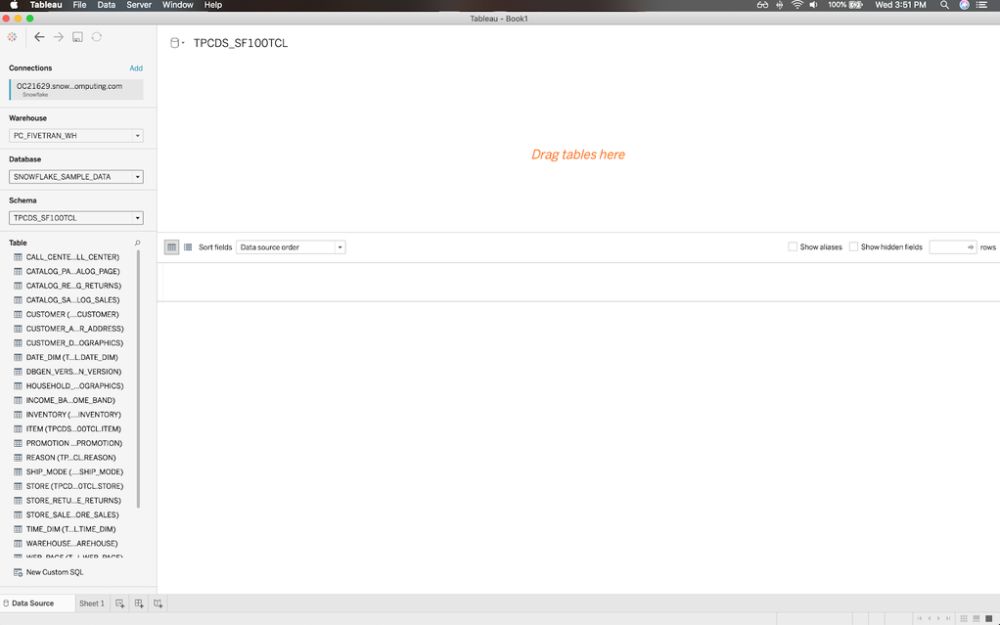
You can start building data models in the box labeled “Drag tables here.” After you drag a table into the box, Tableau will ask you to join every subsequent table to it.
Click over to the “Sheet 1” tab and you will see an interface that appears designed to generate pivot tables. You can rename the worksheet from “Sheet 1” by double-clicking on the tab.
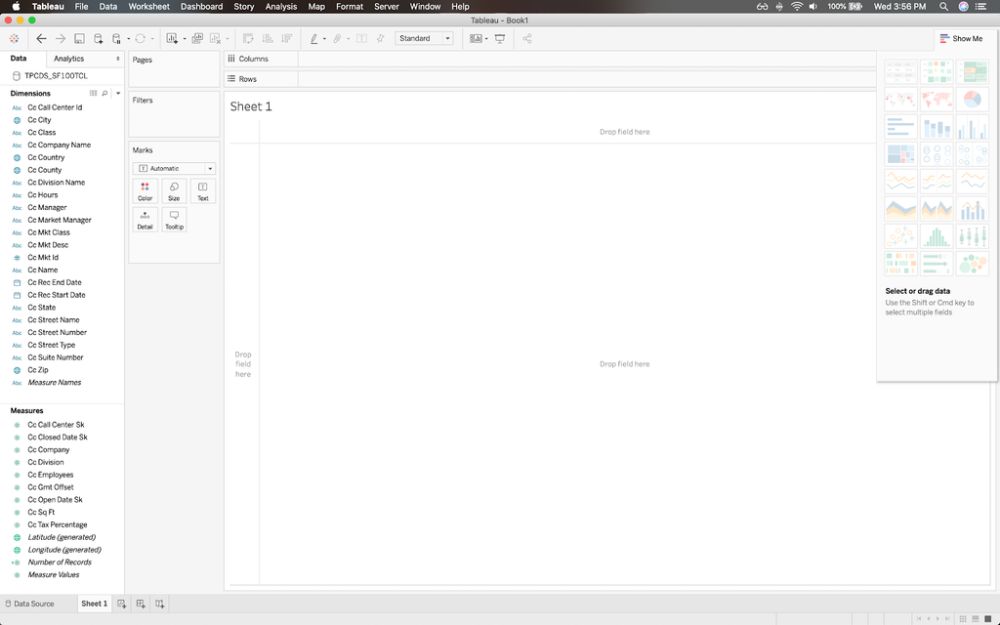
Tableau uses Dimensions, or fields to group by, and Measures, or fields on which aggregate functions (SUM, AVERAGE, COUNT, etc.) are performed.
Here are some visualizations you can make:
Histogram
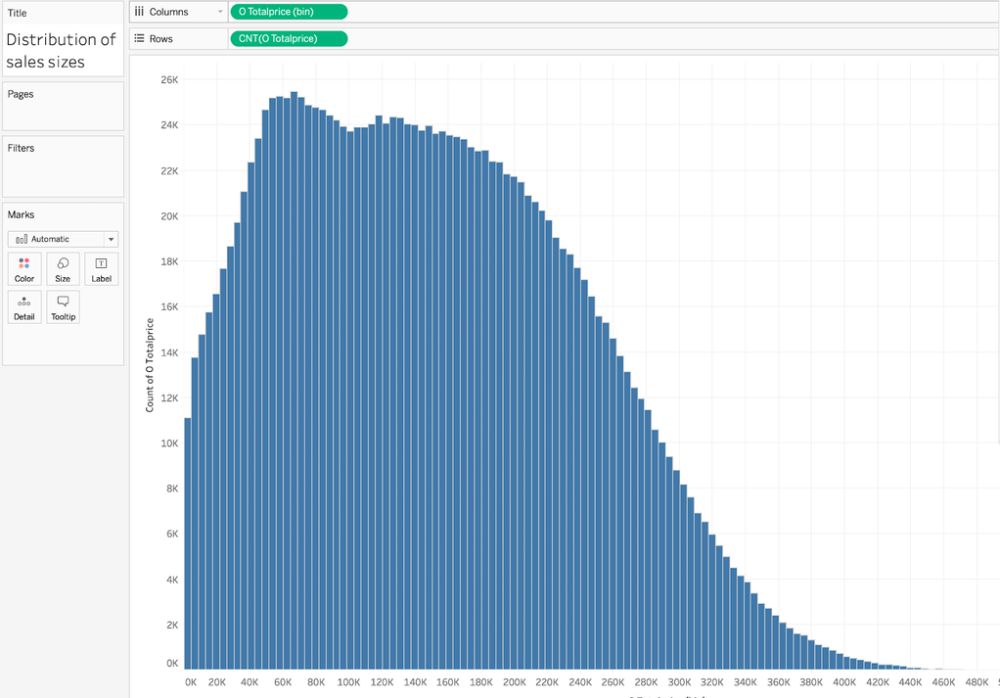
Drag the measure you want to break out into bins into “Columns” and then select “histogram” from the “Show Me” menu in the upper right.
Trendline
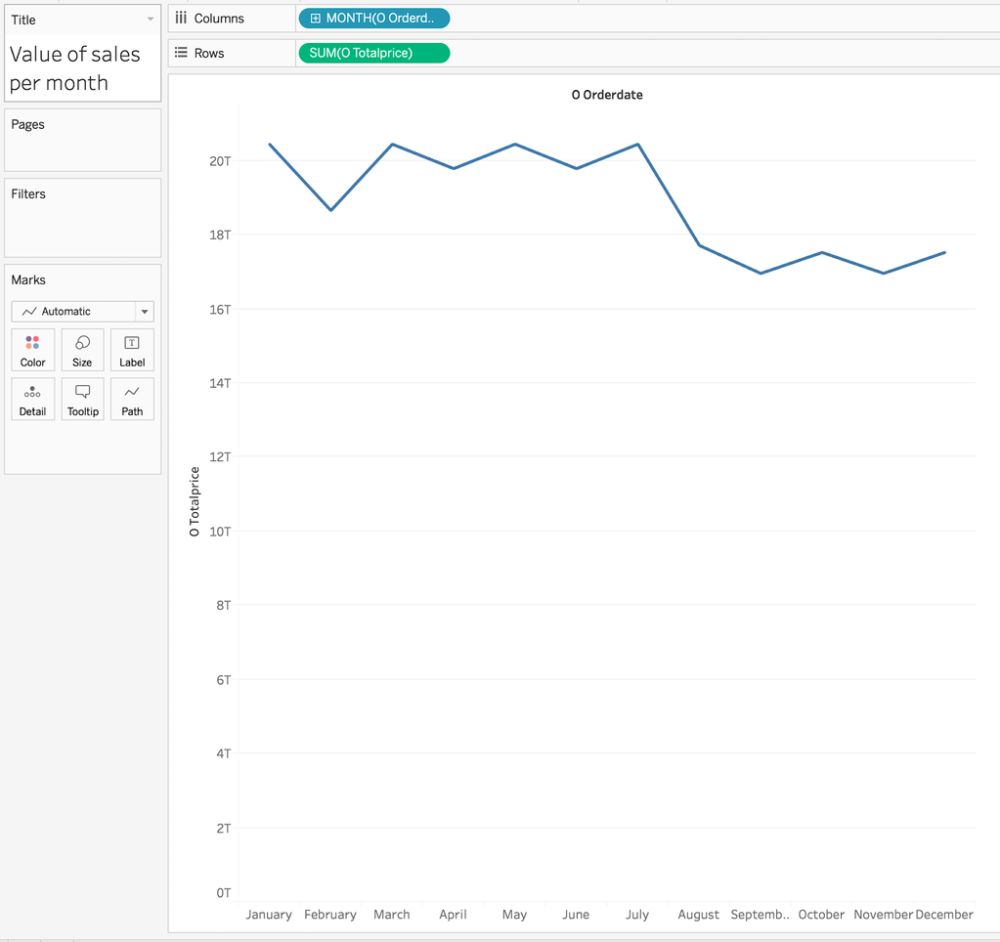
Add a new sheet using the appropriate icon in the lower left. Drag the time dimension into “Columns” and the measure into “Rows.” If your time dimension consists of calendar dates or timestamps, you can click on it to decide on the exact interval you want.
Column Chart (Stacked)
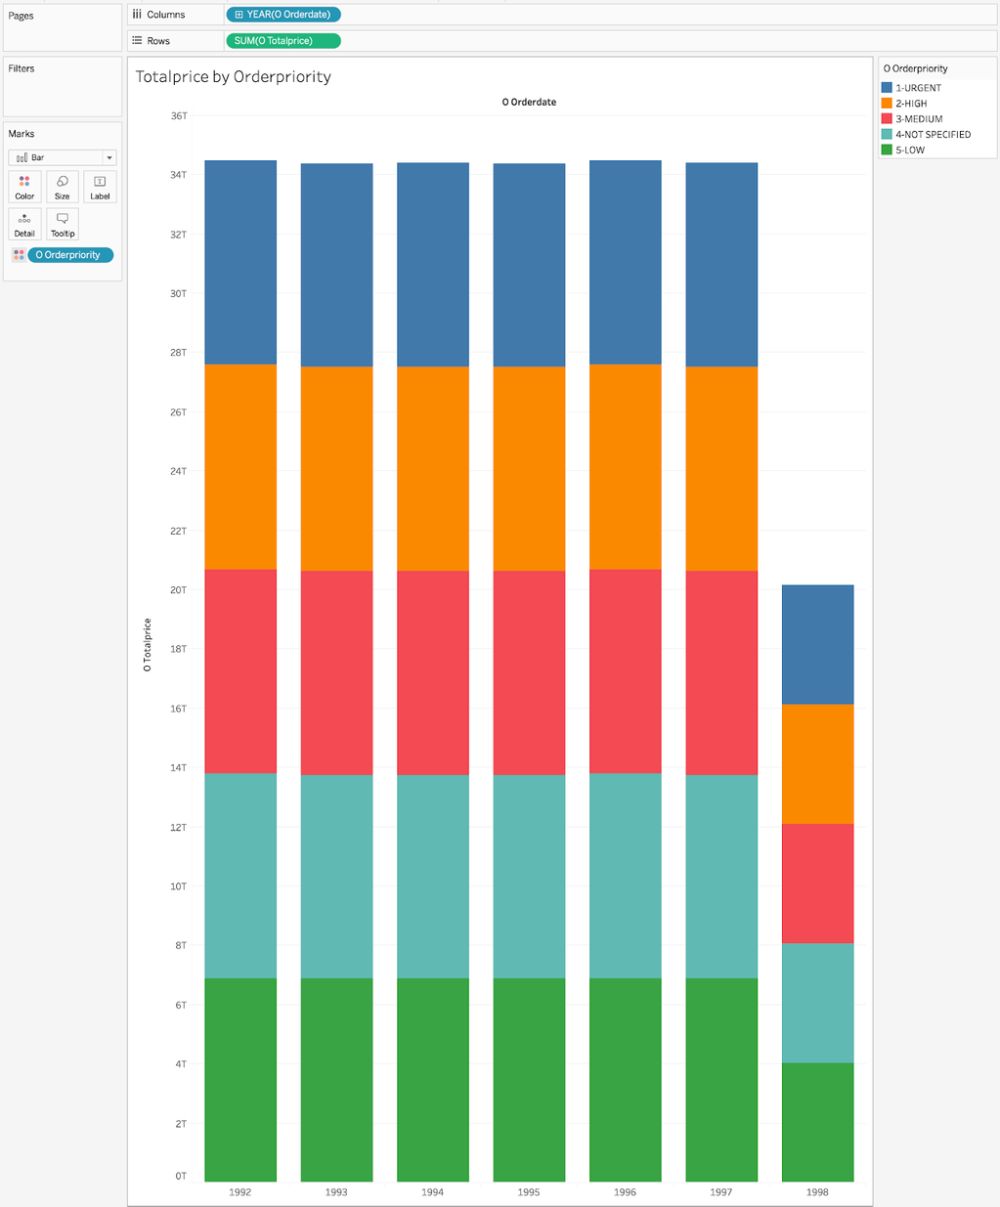
Drag the measure you want to total up into “Rows” and drag your dimension into “Columns.” The dimension that you want to use to divide the columns should be dragged into the box labeled “Marks”; you will want to attach a color code to it as well, which you can do by clicking to the left of the field.
Bar Chart
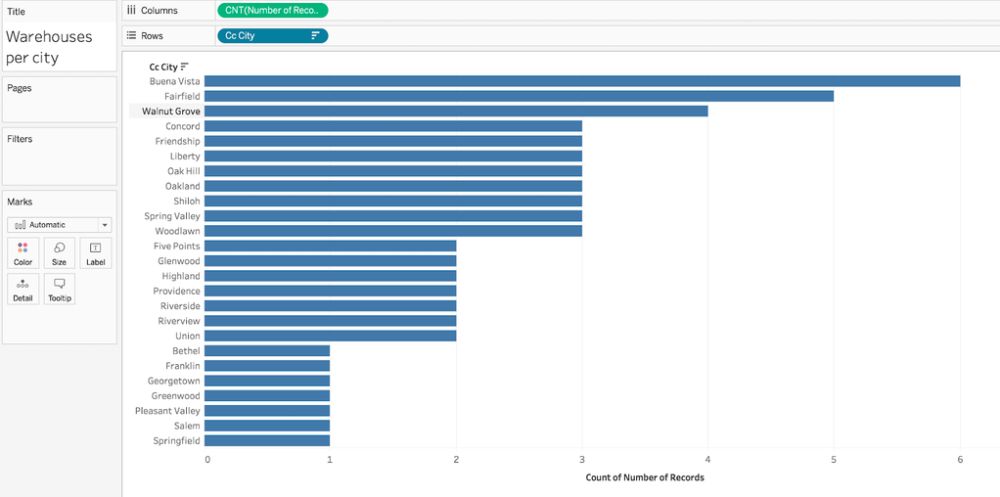
Drag the dimension you want to group by into “Rows” and drag your measure into “Columns.” Select the “bar charts” from the “Show Me” menu in the upper right. To sort the results, click on the dimension in the “Rows” box and select the specific field and direction you want to sort by from the menu.
Worksheets and Dashboards
You can organize visualizations from your worksheets by entering the appropriate tab at the bottom of the screen (“Dashboard 1” if you haven’t changed anything yet) and dragging the sheets you want from the left sidebar. Note that you must adjust the dimensions of your dashboard by changing “size” in the upper left.
Publishing TWBs Online
By default, your TWBs will be saved locally in a directory labeled something like Documents/My Tableau Repository/Workbooks. You can share them through Tableau Online using the Share button.
Bringing It All Together
By connecting Snowflake to Fivetran and Tableau, you will have, in the space of minutes, assembled a full-fledged data pipeline. This is proof that getting started with business intelligence, analytics and data science doesn’t have to involve serious outlays of time, effort and agony. If you need help at any point during setup, just get in touch with our support team.


