

Our Philosophy of Standardization
At Fivetran, our stock-in-trade consists of data connectors with standardized schemas. We strive to give our customers confidence that their data is faithfully represented from their sources. All of our customers end up with the same schema in their data warehouses.
We also partner with business intelligence platforms such as Looker to offer our customers a full data stack that enables them to pursue analytics and other practical uses of data. Looker offers a proprietary language called LookML, which is often organized into libraries called Looker Blocks. The combination of standardized schemas and Looker Blocks affords us the unique opportunity to offer our customers plug-and-play analyst recipes. People using business intelligence from Salesforce, Zendesk, and Marketo have to answer many of the same questions. There is no need for them to reinvent the wheel.
LookML: A New Approach to SQL
LookML can be thought of as a data modeling tool in the guise of a wrapper for SQL. It provides a layer of abstraction that greatly simplifies and modularizes grouping, aggregating and joining. It also provides a built-in hierarchy for organizing and structuring code. Some organizations use Looker as an ad hoc transformation layer.
The LookML taxonomy is visually represented below:
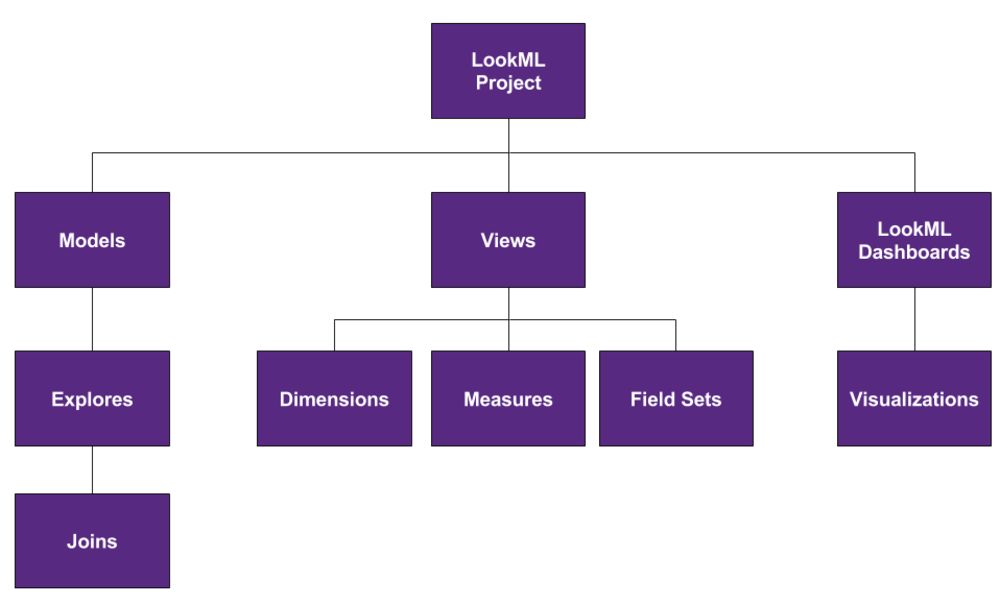
Image courtesy of Looker’s documentation
The highest-level unit of analysis in LookML is the project. It is a container for models, views, and dashboards. Use projects to organize your analytics projects at the highest level and manage database connections and permissions. Projects are also linked to Git repositories. By default, every developer using Looker is assigned a branch for every project. This allows LookML to be used collaboratively with version control.
The purpose of a model is to organize your analysis on the basis of business needs. People with different business needs (i.e., roles and job titles) should use different models. Models are composed of explores, which allow you to label and join views.
Views are constructed from tables within the database you are connected to, or from derived tables composed of values joined from multiple tables. Since nearly all analyses involve aggregation, each view contains dimensions that represent columns to which the SQL statement GROUP BY is being applied, while measures represent aggregate functions. Field sets are arrays of dimensions and measures that can be referenced elsewhere, such as joins and drill fields. Drill fields are parameters that allow you to filter by dimensions or see the records a measure is comprised of.
Dashboards are collections of visualizations, which are numerical or graphical displays members of your organization will consult to make decisions. When you build a visualization, you will select an explore on which to base it.
A Simple Example
Let’s walk through some Salesforce data from the Fivetran connector. We will be building a visualization showing the gross revenues contributed by your sales representatives every year.
The LookML development environment is accessible in Looker by navigating through Develop and clicking on a project. Note that only admins are able to add new projects through Develop > Manage LookML Projects, and that once you are in a project you must activate Development Mode in order to edit anything.
After clicking on a project you will see an interface in which you can select models and views on the left sidebar and edit code through a text editor on the right. Note that the upper portion of the left sidebar also indicates your branch for that project. You can use the blue button in the upper left to validate your code, navigate between branches, commit and push.
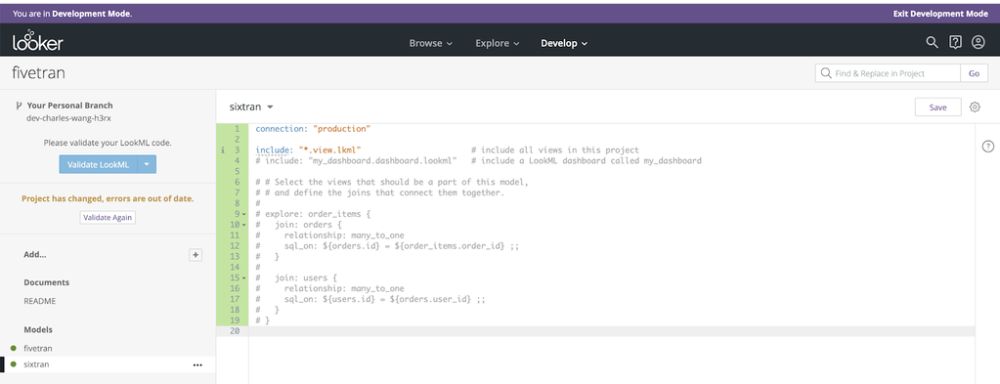
Add a new model using the “plus” button by “Add…” and call it what you will. Mine is called “fivetran.”
Use the following code to set your connection, indicate which views and dashboards to include, and create an explore called “opportunity.”
connection: "production" include: "*.view" include: "*sf.dashboard" explore: opportunity { }
Note that the connection should be whatever your company uses to refer to its data warehouse; it needn’t be named “production.” You should see a red warning with a white “x.” Hovering over it will return the following:
Explore name must match a view name, or the explore must provide a ‘from:’ or ‘view_name:’ property
Your next step, naturally, will be to create the view called “opportunity” — based on the very same table in your Salesforce data — for your model to refer to. First, use the “Add” button to add a view. Call it “opportunity” and enter the following code:
view: opportunity { sql_table_name: salesforce.opportunity ;; dimension: amount { type: number sql: ${TABLE}.amount ;; } dimension_group: created { type: time timeframes: [ raw, time, date, week, month, quarter, year ] sql: ${TABLE}.created_date ;; } dimension: is_won { type: yesno sql: ${TABLE}.is_won ;; } measure: total_revenue { type: sum sql: ${amount} ;; # value_format: "$#,##0" value_format: "0" } }
Note that the dimensions all refer to fields from the original table while the measure represents an aggregation function. “Amount” in our table represents the revenue from this opportunity. Pay attention especially to the dimension group “created.” We will be using the timeframe values to aggregate the data on the basis of year. “Is_won” allows us to only count accounts that became customers. “Total_revenue” allows us to sum up “amount.”
Visualize It
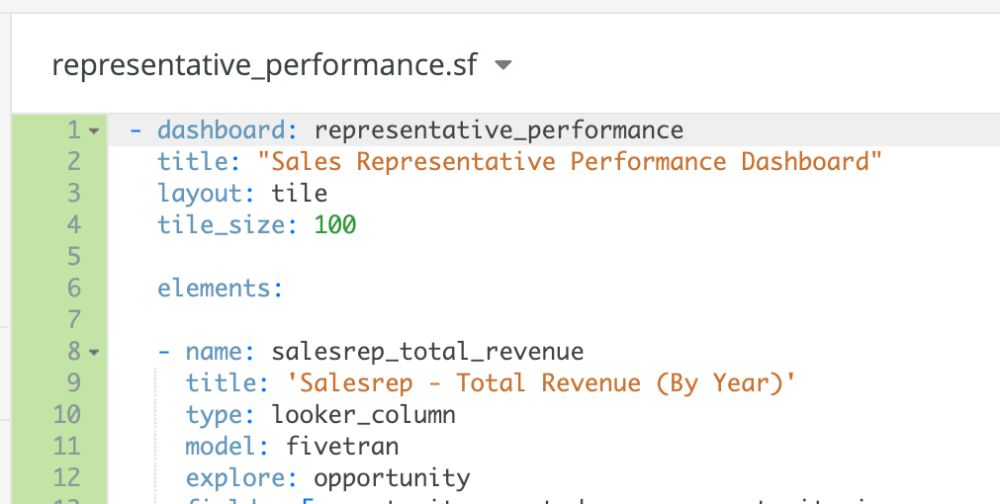
Now, go to “Add…” again to create a dashboard. For the purposes of this example, name it “representative_performance.sf.” Recall that we set our model to recognize files with the “*sf.dashboard” extension — this is what we were preparing for. The code will look like so:
- dashboard: representative_performance title: "Sales Representative Performance Dashboard" layout: tile tile_size: 100 elements: - name: salesrep_total_revenue title: 'Salesrep - Total Revenue (By Year)' type: looker_column model: fivetran explore: opportunity fields: [opportunity.created_year, opportunity.is_won, opportunity.total_revenue] filters: opportunity.is_won: 'Yes' sorts: [opportunity.created_year] limit: 500 font_size: small
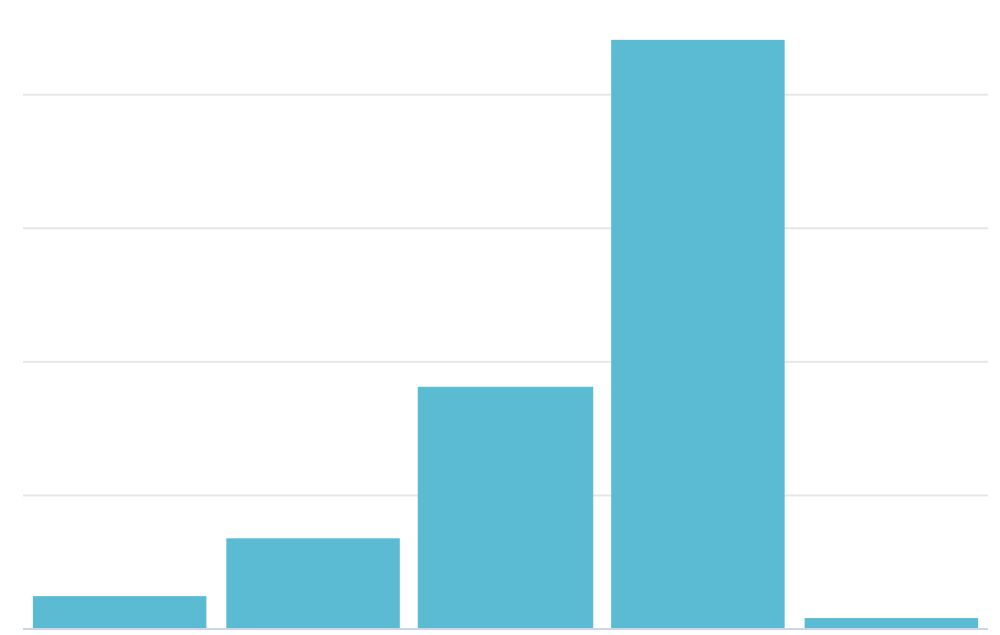
These parameters should be fairly self-explanatory. Pay special attention to the fields, filters, and sorts. To view the dashboard, go to the little downward-pointing triangle by the file’s header. Click and “View dashboard.”
You will get a column chart showing revenue per year.
This is only the tip of the iceberg for LookML. Our example is an extremely stripped down version of the Looker Block for the Fivetran Salesforce connector and doesn’t contain any joins, extensions, or derived tables. Check out (and use!) the Looker Blocks for Fivetran for more thorough examples.
You may also find it worthwhile to attend the one-day Looker Developer Bootcamp.
Raising the Baseline
Organizations are often in the position of solving analytics and business intelligence problems with known solutions. The combination of Looker Blocks and standardized schemas from Fivetran provides these known solutions and raises the baseline of analysis that is easily accessible to our customers. Our goal is to send you well on your way up the hierarchy of data needs.
Learn more about what Looker and Fivetran can do for you with a demo here.


