
Are you making the most of your data? All of your transactional systems — sales, marketing, HR, purchasing — generate and reflect activities in the real world, but they don’t tell you how to improve the numbers. That’s where business intelligence (BI) software comes in.
What is business intelligence?
What is business intelligence? In short, it’s a set of technologies that turn data into actionable insights, which you can use to make more informed strategic decisions. Business intelligence presents data as reports, visualizations and dashboards, which may include graphs, maps and textual summaries.
BI helps managers correlation data from different sources to show trends. Managers can use BI to surface actionable insights to make better business decisions.
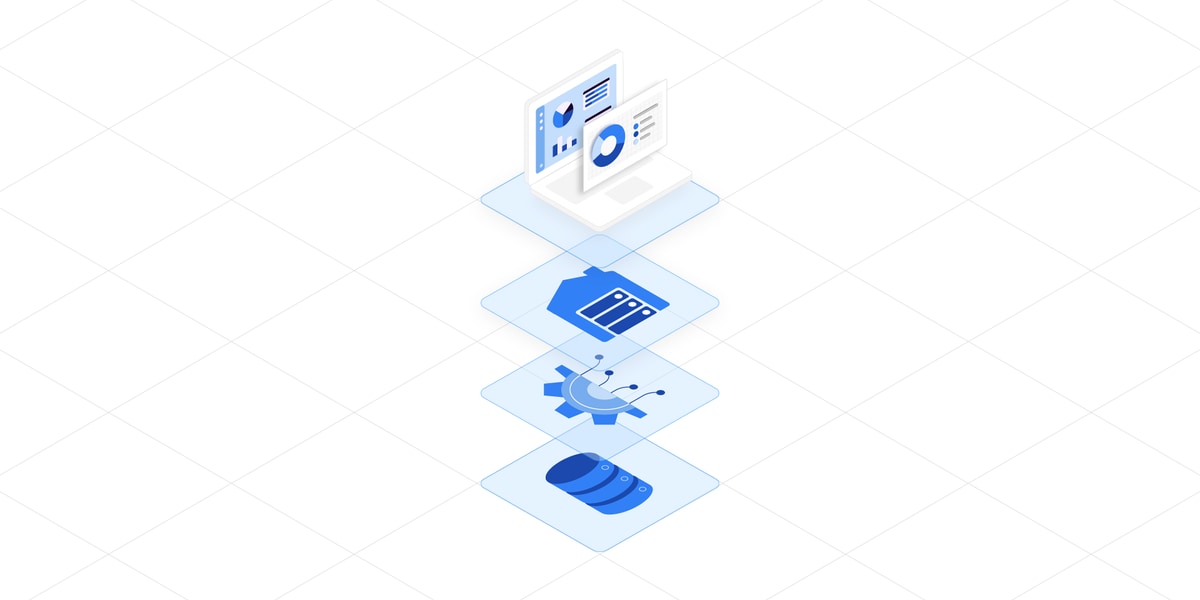
Like raising a child, it takes a village — or rather a whole software ecosystem — to get useful, actionable business intelligence and improve business decision-making. The ecosystem comprises data sources, a data warehouse, an ETL tool to get the data from the sources to the destination, and analytics software.
All together, these software tools make up the modern data stack. Let’s walk through the process by which the modern data stack supports business intelligence.
About the business intelligence process
Let’s walk through the process by which the modern data stack supports business intelligence.
First, get (and store) the data
It probably goes without saying that business intelligence relies on data. Before you can create a report, you need something to report about.
Fortunately, your organization already has the data you need. Every online transaction processing (OLTP) system generates new data all the time, as people buy things, change statuses, and start and finish tasks.
But there are two problems with the data you already have. First, it’s in OLTP systems and not OLAP (online analytical processing).
- OLTP systems work on data one record at a time — adding new events, updating information in a record already stored on a system, and deleting obsolete data.
- OLAP systems work on groups of records at a time to uncover the kinds of trends you can find by looking at large numbers of things and summarizing them.
We wrote more about the difference in a recent blog post about the difference between a database and a data warehouse.
The second problem is that you have related data in multiple applications that don’t talk to each other. For instance, you might have customer names and addresses in Salesforce, payment history in a retail SaaS application, and delivery information in a shipping platform — but you can’t form a full picture of your experience with your customers because those platforms don’t see each other.
The way to fix both of those problems is to replicate your OLTP data into an OLAP platform, such as a data warehouse. A data warehouse can hold data from multiple sources, and lets you create reports that combine data from all of them.
Of course you need a data pipeline that can not only copy a snapshot of your transactional systems, moving the raw data into the data warehouse, but repeat that task over and over at whatever cadence you need to provide timely data for reporting. Here, Fivetran is your friend. We extract the data from more than 150 sources, transform it as necessary, and load it into a data warehouse, where you can use it to start creating business intelligence.
Generating business intelligence
The final layer of the data analytics stack is reporting software. Dozens of BI tools can access your data and turn out different forms of business intelligence:
- Reports — You can produce static representations of data that relate and combine data from multiple sources, massaging it into snapshots of your organization’s status.
- Visualizations — You can also turn that data into graphs, charts, and other visual representations of information. People find it easier to compare proportions when they’re represented visually, or see trends over time when they’re shown in a line graph.
- Dashboards — You can customize the data you see with a dashboard that updates more-or-less in real time and lets you select fields, filter values, and sort the display to show exactly the kind of analysis you want.
A wide range of BI tools are available, and most of them offer free trials so you can see how well they generate the kinds of resources you need. Different tools suit different use cases. We wrote a business intelligence tools comparison to help you know what to look for. We’ve also made some predictions about the top trends in business intelligence tools to watch in 2021.
Often, managers can generate BI themselves (and when they do, they may be called “citizen analysts”), but some really tricky analytics might require the help of a professional data analyst or even a data scientist to perform more advanced data analysis.
You can’t automate everything
All of this is wonderful, but there’s one thing even the best business intelligence tools can’t do: They can’t make decisions for you. BI is backward-looking — it helps you see what happened in the past, either as a snapshot of a particular moment or in trends over time. But humans are still better than computers at deciding what to do with that information.
Businesses still need people with experience and expertise to consider BI in the context of not only budgets and workforce availability, but also organizational goals and priorities. They may also need predictive analytics tools to help anticipate what will happen next. But BI tools can present managers with the data they need to make those strategic and tactical decisions.


