How we do performance engineering at Fivetran
.png)

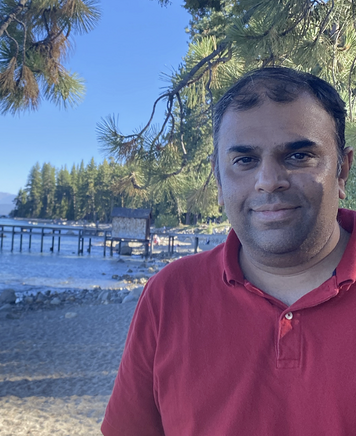
At the end of 2023 we said, out loud, "we need to make Fivetran a lot faster."
That sentence had been said before. The engineering organization had been trying to make the product faster for years, and we had made real progress. Yet, our progress was woefully short of our goals. Our requirements called for a 2x-3x speedup on high-volume database pipelines. We were shipping improvements in 10% increments, and a distressing number of those increments didn't survive contact with production. Ten percent here, eight percent there, and the end-to-end number barely moved.
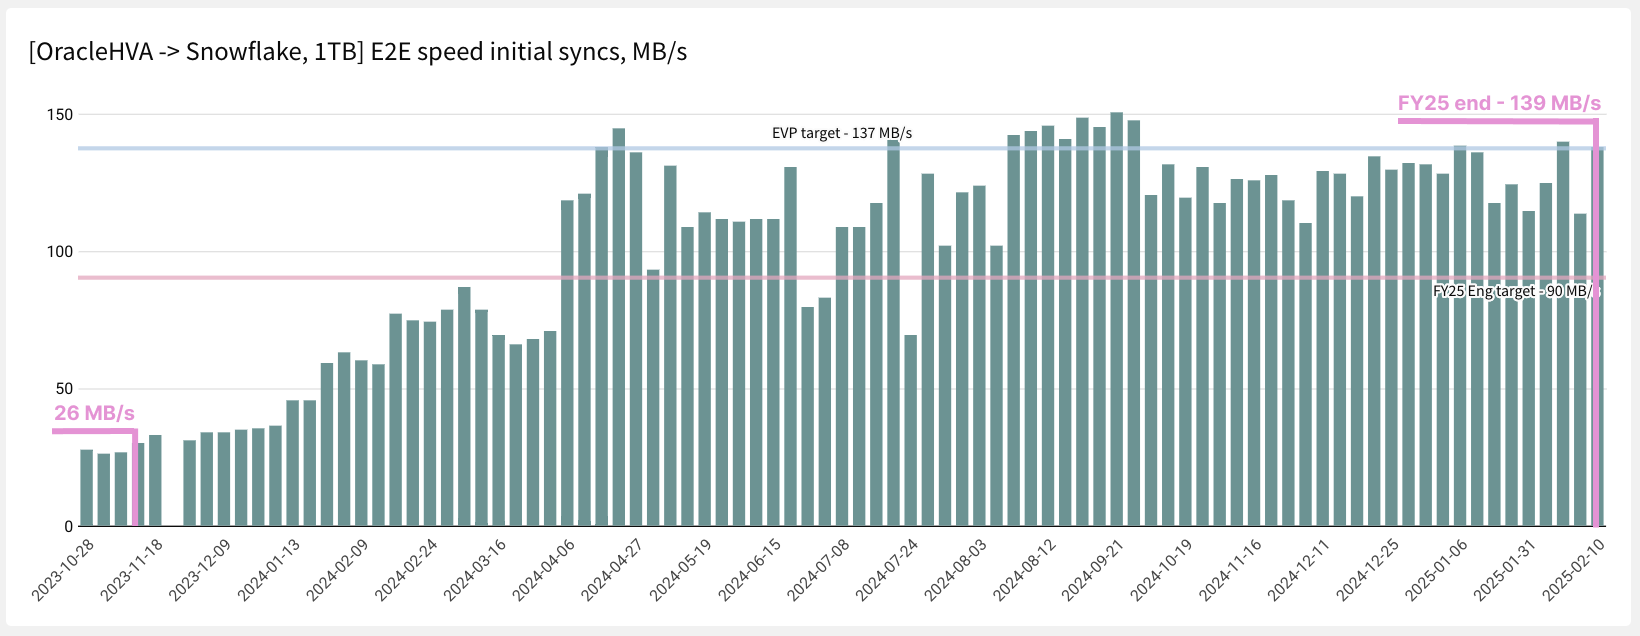
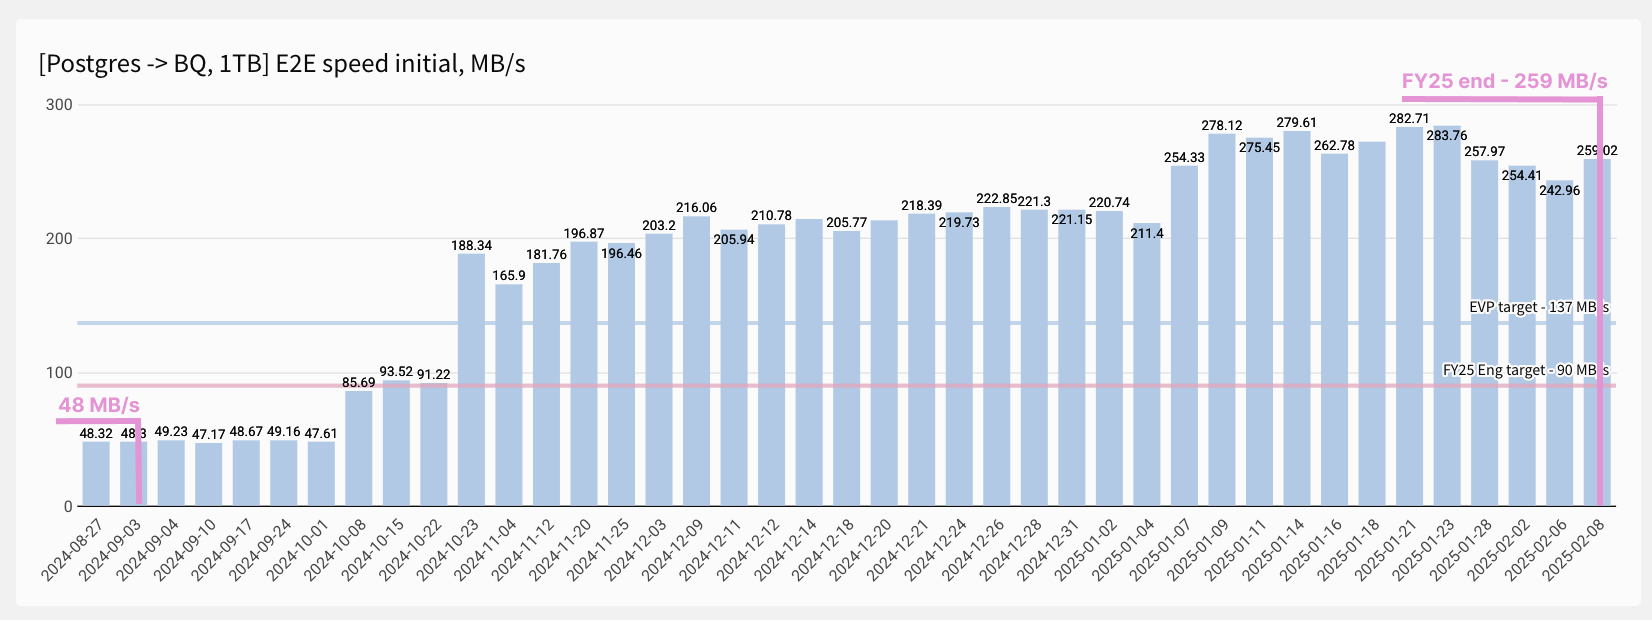
The specific ask came from our revamped Enterprise Product requirements: move 1 TB of data in two hours. That is roughly 137 MB/s, sustained, end to end, from a customer's production Oracle database into their Snowflake warehouse. At the time, our Oracle HVA to Snowflake initial sync benchmark ran at 26 MB/s. Postgres to BigQuery ran at 48 MB/s. Nobody in the room believed 137 MB/s was reachable by doing more of what we had been doing.
Two years later, that Oracle benchmark ran at 139 MB/s and Postgres to BigQuery ran at 259 MB/s. Production process throughput went from 7 MB/s to 70 MB/s — a 10x improvement in the raw capacity of Fivetran's core. We closed the High Speed / Low Latency (HSLL) program having met every one of its throughput OKRs, after delivering roughly 50 projects.
This is the story of how we got there. The numbers are the least interesting part. What matters is the set of techniques we developed to measure a distributed data pipeline, to decide what to work on, and to organize people around a whole system instead of its parts. Building a performance engineering competency is the lesson that many engineering organizations aspire to learn.
[CTA_MODULE]
Measuring first: "if you can't measure it, you can't improve it"
That quote gets attributed to several different management gurus. In our case it was simply the first problem to solve. Before we could make Fivetran faster we had to answer two questions: how fast is fast, and by that standard, is Fivetran fast?
Choosing a metric
We considered rows moved per unit of time, several definitions of latency, and data volume throughput. We settled on data volume throughput, specifically megabytes per second, as the primary metric. Our customers have a source database, file store, or SaaS service stuffed with data. What they care about is how fast that volume moves. Rows per second is seductive because it's easy to count, but a row is not a fixed unit: a 40-column row with three TEXT fields and a 4-column row of integers are not the same work. Volume is the unit that stays honest across connectors, across datasets, and across time.
Volume turned out to be harder to define than expected. Different database engines report extract volume differently, because they read logs differently and count bytes differently. Comparing Oracle throughput to Postgres throughput was, for a while, comparing two different things. Our Performance Engineering Tiger Team (more about that later) eventually proposed serialized extract volume — the volume of data as our own pipeline serializes it, measured at a single point we control — as the normalizing metric. That one decision made cross-database comparison possible and is quietly one of the highest-leverage things we did.
Instrumenting the code
Having picked a metric, we instrumented the pipeline to emit this metric at certain checkpoints, both time-based and volume-based, at every phase boundary. A Fivetran sync has three phases: extract from the source, process in core, load to the destination. We needed volume and duration for each, per table and per sync, written to a place we could query later. Those each became sync_stats and table_stats tables in our BigQuery data warehouse, and nearly every tool and dashboard we built afterward reads from them. We had been collecting these tables from previous efforts, but our most recent performance engineering effort focused on adding the right metrics to these tables.
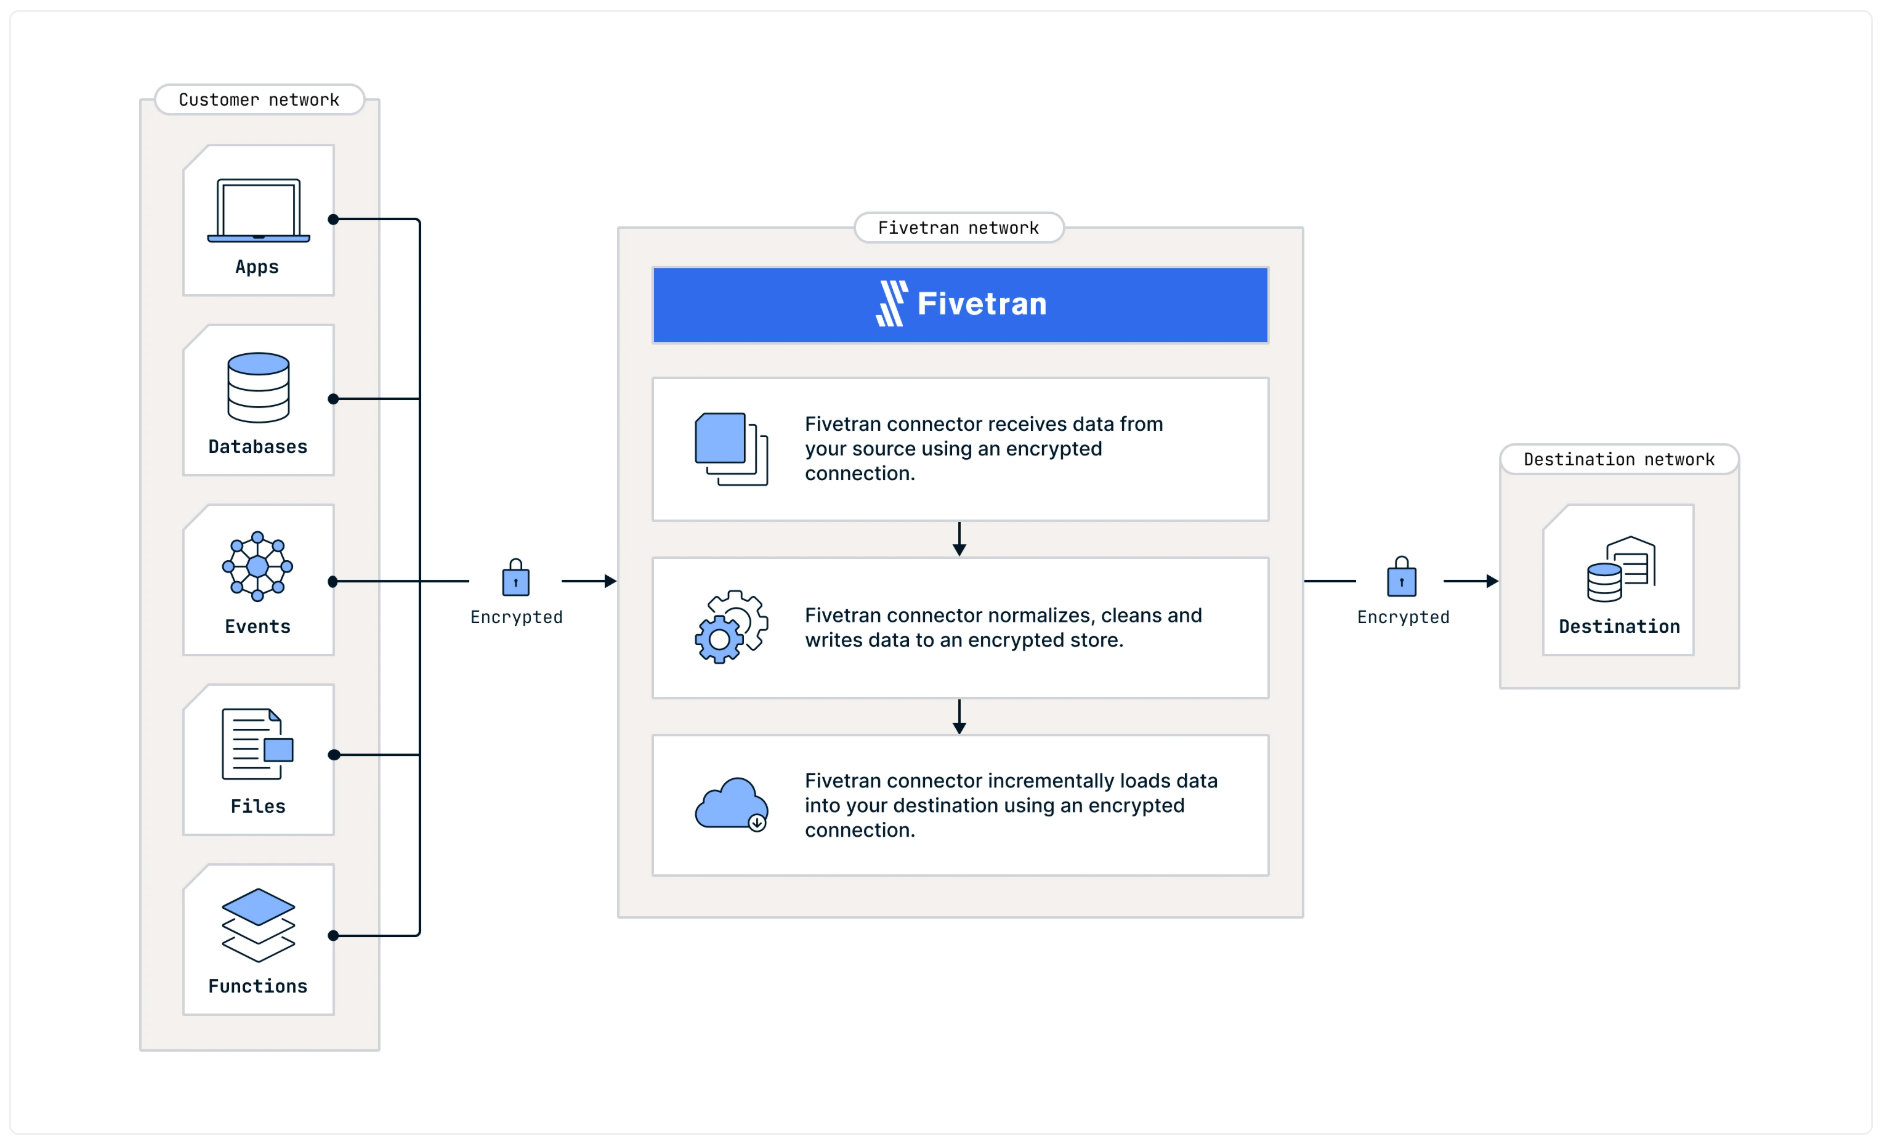
Simple Fivetran architecture diagram as stand-in for a slightly more detailed version. Found at this link
If you plan to do performance engineering, do not skip this step and do not do it halfway. A reasonable proxy for the performance of a system is a precondition for improving that system. We spent real weeks on instrumentation before we made a single optimization, and every one of those weeks paid for itself.
Benchmarking the product
Instrumentation tells you what production is doing. It does not give you a repeatable experiment. For that we needed benchmarks, and benchmarking has been the first step of every performance effort we have run since.
We determined that we needed to benchmark the two modes in which Fivetran syncs data: initial and incremental. There are variations of each, but those two are the primary ways the product operates. For the data itself we had three options:
- use a known benchmark dataset, such as TPC-C
- scrub actual customer datasets and benchmark against those
- create a custom dataset
We chose TPC-C, largely because a TPC-C-based benchmark had already been published for HVR, another product in our portfolio, which gave us a point of comparison outside our own walls. We knew the dataset was not ideal — early experiments showed that dataset shape (row size in particular) could move throughput by about 20% with everything else held constant. We wrote that down as a known limitation and moved on. A benchmark you actually run beats a perfect benchmark you are still designing.
The benchmark suite that came out of this now covers twelve high-volume scenarios, run three times a week in our staging environment:
- Oracle HVA to Snowflake, Postgres to BigQuery, SQL Server to Databricks, MySQL to Snowflake
- Initial syncs at 50 GB (~97 GB of database data across 140 tables) and at 1 TB
- Incremental syncs against a live source generating 70 MB/s of change, at 20% and 40% data retention, syncing every 10 minutes and every 1 minute respectively
Every parameter is pinned: cloud provider, region for source, destination, and the sync worker, instance types, warehouse sizes, JVM heap. The source and destination live in the same region for maximum benchmark throughput and to eliminate network slowness as a factor. One of our early "improvements" turned out to be an artifact of a benchmark whose Snowflake instance was in a different region from the source, which matters when tuning a benchmark.
Benchmarks can also be launched on demand from CI, against a branch or with a feature flag enabled, which is how we test a candidate change before it goes anywhere near production. CPU profiling with async-profiler runs by default on benchmark builds, and the flame graphs come back as build artifacts, readily accessible as HTML files in a cloud storage bucket.
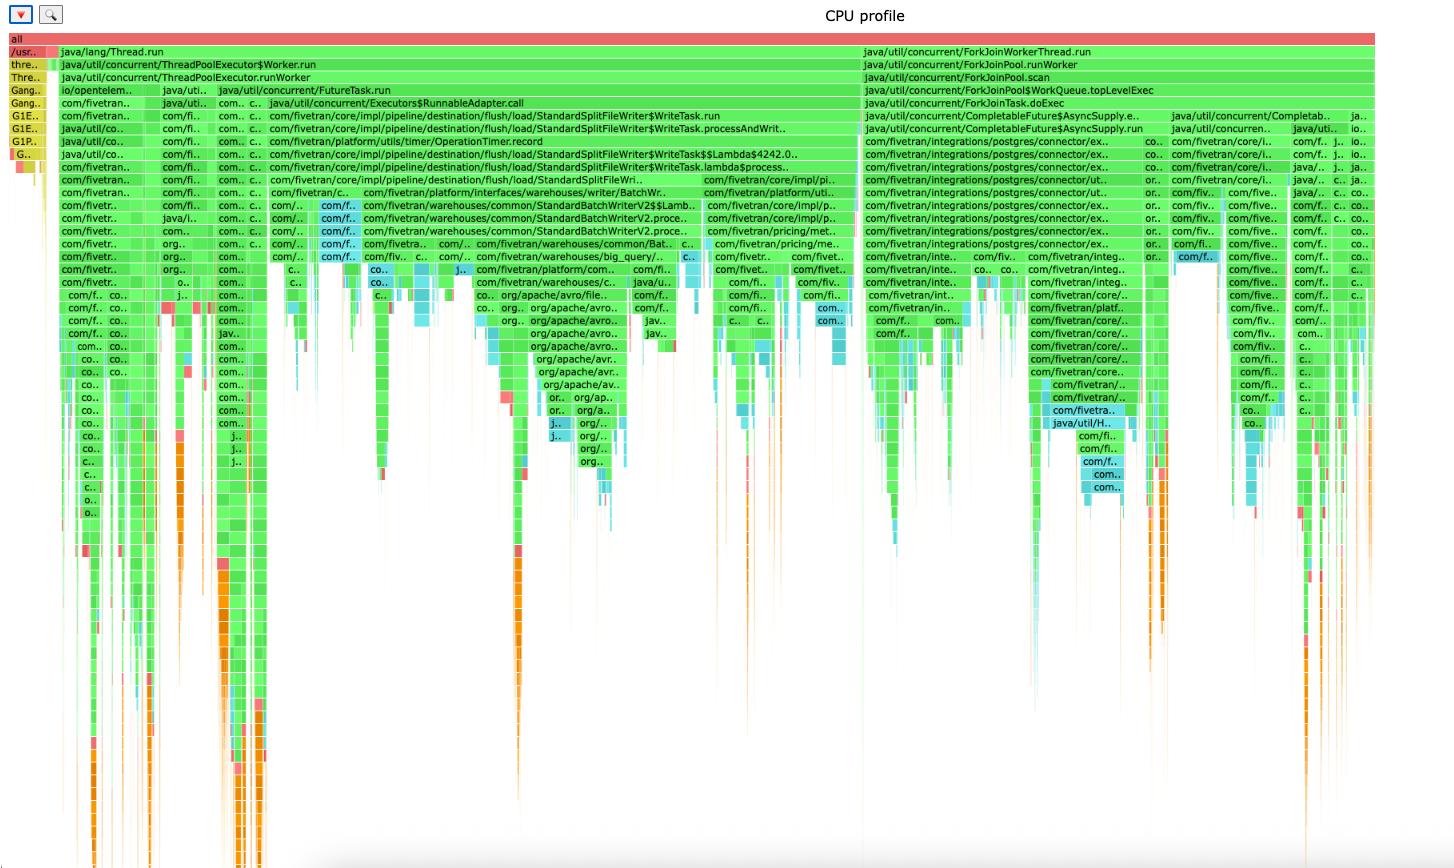
Example of our automatic and bucketed HTML profiles produced for each benchmark run
Building a tool to see inside a sync
Aggregate throughput tells you a sync was slow. It does not tell you why. So we built sync_progress_graph, a tool that pulls our stats tables (mentioned earlier) for a given sync and plots the detailed progress of every table through every phase, on one timeline.
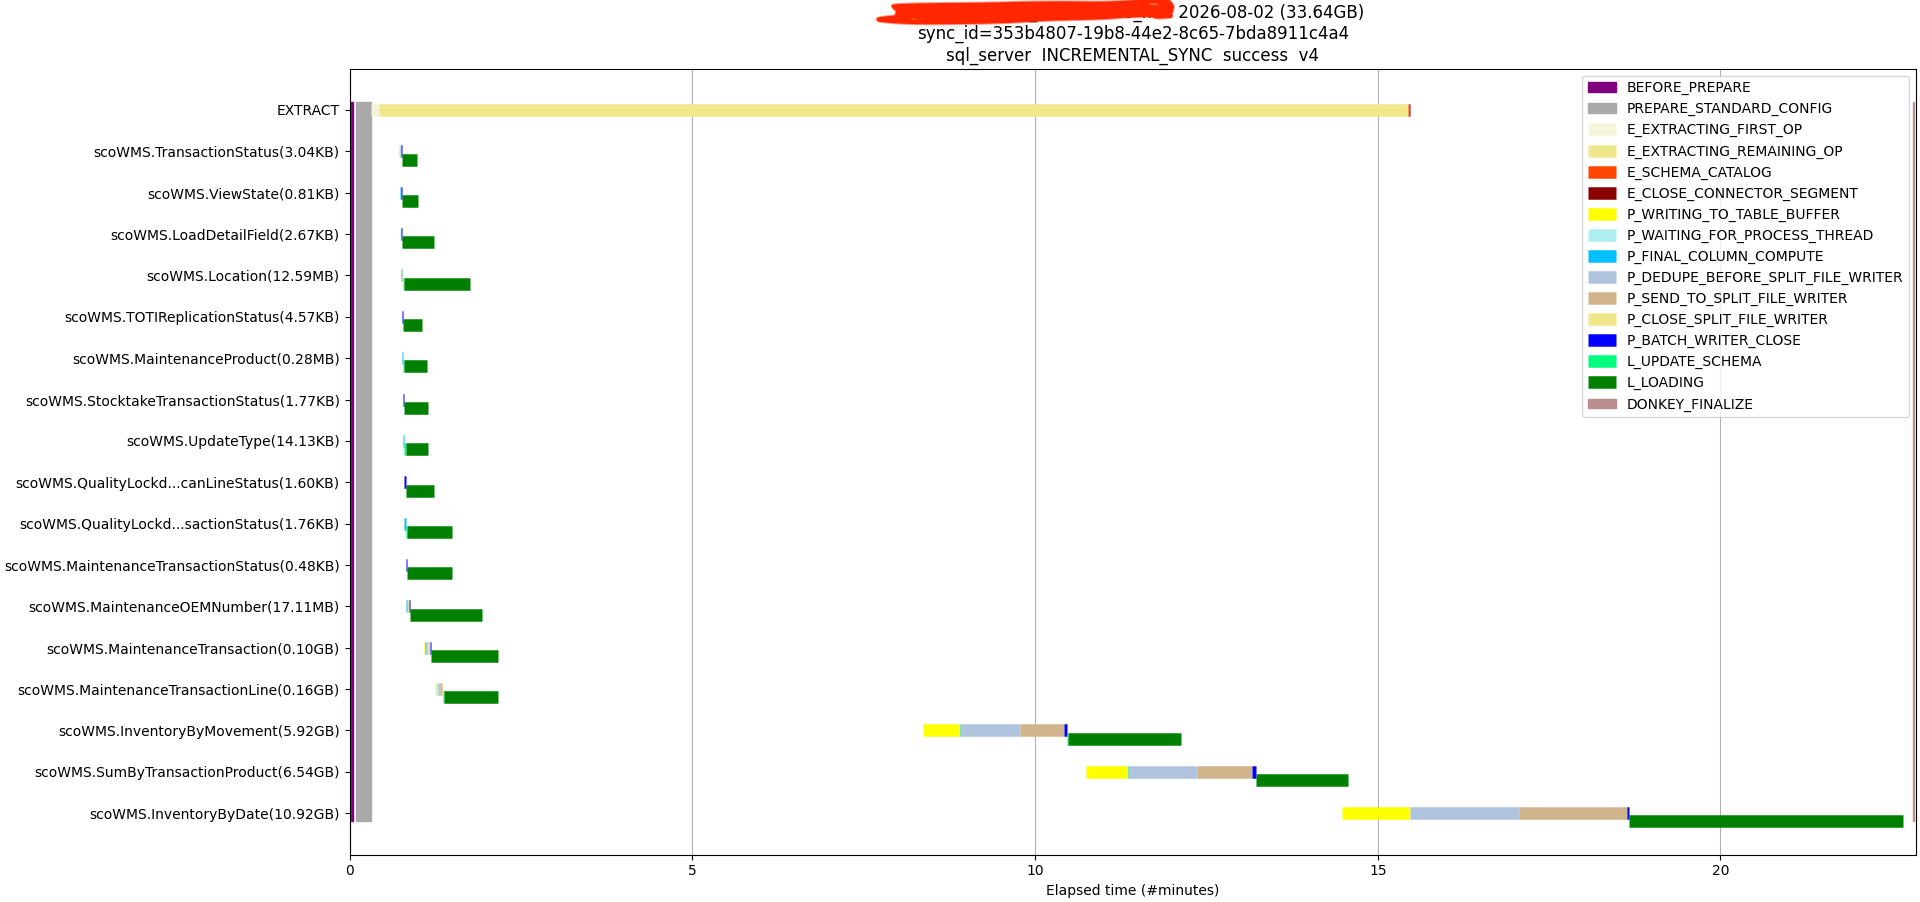
This tool changed how we thought. A sync stops being a number and becomes a picture, and in that picture the bottleneck is usually visible to the naked eye: a staircase where tables extract one at a time instead of in parallel; a long flat region where process workers sit idle waiting for a global flush; a single enormous table whose load phase extends past every other table's completion. You can zoom into the last several minutes of a sync, limit to the ten largest tables, or plot three consecutive syncs of the same connector side by side to see whether a change actually did anything.
The tool started life on an experimental branch. One of the action items from our first team retro was to move it to our main branch so everyone could use it. Make your diagnostic tools public early; a tool that only its author can run is barely a tool.
Recording every benchmark result
This is the practice I most want other teams to copy, and the one that sounds least like engineering.
We kept a spreadsheet — the "Salt Flat Speed Log," named for the Bonneville Salt Flats where people go to set land speed records. Every row was a dated entry: who did it, what kind of activity it was, what change was tested with a link to the details, and then the resulting E2E, extract, process, and load throughput, plus the raw volumes and durations behind each. Eventually, we graduated to a proper dashboard in Sigma, fed by the same BigQuery stats, and the spreadsheet's job passed to that.
Alongside the numbers, we kept the Benchmark Improvement Record: a running prose record of every noticeable change in a benchmark's baseline, with the explanation. Roughly fifty entries over two years, each one dated and named — "7 Jan 2025 (Speed up Postgres 1TB Initial)," "16 Sept 2025 (Speed up SAP Initial Sync Benchmark)."
Two things about that record are essential:
- It records regressions and baseline changes, not just wins. A meaningful fraction of the entries are titled "regression in..." or "Change of baseline for...". When a benchmark drops 15% and nobody knows why, that is a finding, and it needs a home. When it drops because you deliberately changed the source instance type, that needs a home too, or six months later someone will chase a ghost.
- It explains cause and effect in enough detail to be re-derived. Not "enabled the feature flag and it got faster," but which flag, what it changed in the code, which phases moved and by how much. One entry reads: enabling SapHanaDbSendBatchCompleted raised the small SAP initial sync benchmark 21% to 94 MB/s, because the connector now emits a BATCH_COMPLETED event when a table finishes extracting, so core starts processing immediately rather than waiting for the 100 GB flush buffer or GLOBAL_CLOSE; process speed +6%, load speed +18%.
Having this record prevented us from revisiting techniques attempted in the past. Historical context, cause and effect, and no duplicated effort. Two years in, that record is the single most valuable document the program produced.
Improving: a queue of ideas, most of which will fail
With measurement in place, improvement becomes a throughput problem of its own: how many hypotheses can you test per week, and how cheaply can you kill the bad ones?
Brainstorm widely, and expect more than half to fail
This needs to be said explicitly and repeated, because it is a top reason performance efforts die. If a team believes each idea is supposed to work, then every failed experiment feels like a personal failure, people stop proposing risky ideas, and the effort collapses into safe 2% optimizations. Our working assumption was that more than half of what we tried would not pan out. That expectation is what made it safe to try the things that produced 2x.
We did a lot of brainstorming, and we did it as one group with all the disciplines in the room. Our standups were not status meetings; they were technical discussions, and the team explicitly listed "productive brainstormings and deep technical discussions" as the thing to keep doing when we ran our first retro.
Keep a queue of changes
Rather than testing one idea and arguing about it, we maintained an ordered queue of prospective changes to apply to a given benchmark. One at a time, measured, recorded — good result or bad. A teammate summarized the value precisely: "having a queue of changes gave us a plan that we were aiming toward." The queue kept the benchmark environment busy and kept the team from over-investing in any single hypothesis.
Prototype locally, and time-box
Big benchmark runs are expensive and slow. Fast local prototypes and micro-benchmarks let us kill ideas in hours instead of days. And every open-ended experiment got an end goal and a time box, which is a lesson we learned by violating it. Our retro's honest self-assessment: we spent too long on the Postgres incremental sync improvement, too long fighting an unstable cloud environment, and too long chasing benchmark fluctuations that had nothing to do with our code. All three should have been time-boxed and cut.
Write down the negative results, with reasons
"It didn't work" is not a result. Why it didn't work is a result, and it is often the thing that unlocks the next idea. This was one of our retro's start-doing items, and it belongs next to the Benchmark Improvement Record in any team's practice.
The Tiger Team: optimizing the whole system, not the parts
Here is the part of the story that mattered most, and the part I would most want a fellow engineering leader to take away.
For years before this, we had been optimizing the parts. The database team made extract faster. The core team made processing faster. The destinations team made loading faster. Each team measured its own phase, each team reported real wins yet end-to-end throughput barely moved.
The reason is the reason it always is. In a pipeline, you don't have three performance problems, you have one. Speeding up a phase that isn't the bottleneck buys you nothing. Worse, our local optimizations sometimes actively hurt: a change that made extract faster would flood a downstream buffer and make process slower; a change that helped one phase would simply relocate the bottleneck to the next phase, where a different team owned it and hadn't planned for it. We were playing whack-a-mole across organizational boundaries, and the boundaries were the problem.
So at the end of 2023 we formed a temporary Tiger Team — Team Ellison, named for a certain database magnate, since the first target was Oracle HVA to Snowflake. The charter was explicit that this was an experiment: the team would disband once it reached at least 60 MB/s, declared the work done, or declared that the experiment wasn't working.
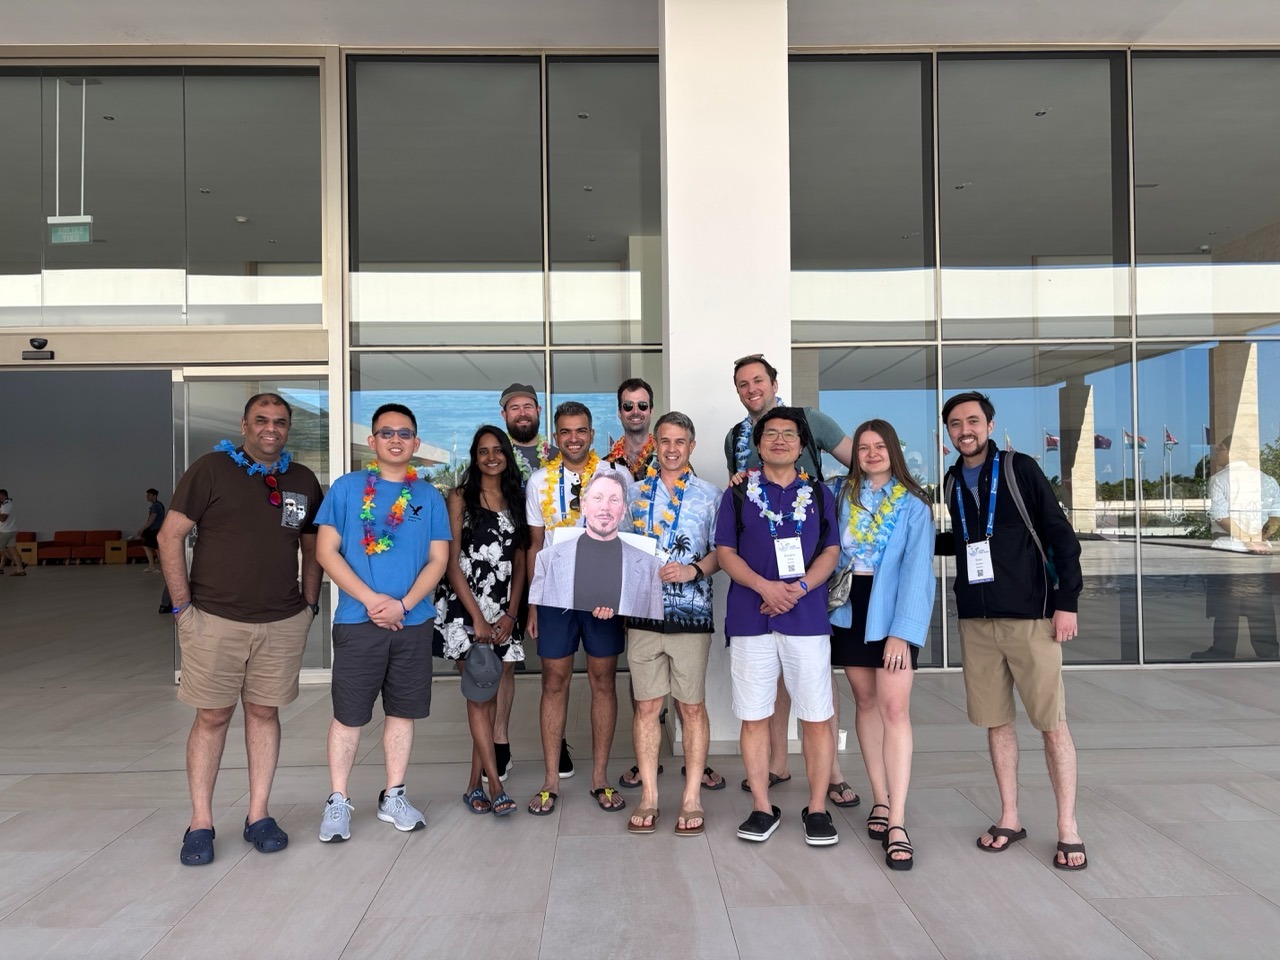
The globally distributed team had a chance to take a photo with our namesake at Camp Fivetran in 2025
What made it work:
Every discipline, and all three parts of the architecture
Connectors, core, destinations, plus infrastructure, plus QE, plus a PM. The whole pipeline had representation in one room, so when the bottleneck moved, it moved to someone sitting at the same table.
No code ownership boundaries
From the charter, emphasis original: "All members of this team can participate in making changes in any part of the sync or infrastructure. This work is only limited by skill/knowledge and not by team or global group boundaries." It went on to name the failure mode directly — in the past we had heard "it's not in our part of the code." That sentence was banned. Every member of the team was expected to strongly endorse this, and it kept the previous mentality in check.
Genuine, protected focus
Team members were exempt from on-call, incidents, escalations, interviews, quarterly planning, their home team's meetings, and all-hands. The charter's words: "The idea is to focus 100% of your actual at-work time on this effort." This was a calculated risk, increasing the burden on their “home” teams for an effort that wasn’t certain to be successful.
One goal, narrow
One benchmark, one number, one dashboard. A team member's retro note: "One common goal. Narrow focus helped in prioritising the work that will help improve the benchmark."
Lightweight process, heavy documentation
We held a daily standup to set the next day's goals and worked Kanban-style rather than estimated sprints. The team held consistent bi-weekly demos with Engineering Leadership to emphasize a regular cadence of progress. We even tried experiments like sub-teams deliberately against each other: when we needed to parallelize one of the core stages, we split into Team Red, which started from the existing implementation, and Team Blue, which wrote a new one from scratch. It helped us understand if a “throw everything out of the window” approach would yield better results.
Explicit simplifying assumptions, negotiated up front
Early on the team sat down and asked what it was allowed to assume: Initial sync only? destination empty? No duplicate keys, so no dedupe? Inserts only, so no MERGE? Types known up front, so no inference? Each answer unlocked a different amount of speed and cost a different amount of generality. As one engineer framed the tension: providing a fully general solution with no assumptions may mean you never reach the north star, but making too many assumptions means shipping something unrealistic. Getting explicit agreement on where that line sits, before writing code, saved months of argument later.
The results speak for the structure. Parallel core, the team's first big project, delivered a 2.5x speedup on Tier 1 database staging benchmarks and rolled out to every production connector. Multithreaded initial import gave Oracle HVA a 5x reduction in extract time, SQL Server a 2x end-to-end speedup, Postgres 3x, and MySQL 3.3x on extract. A custom serialization format — faster than Protobuf, and requiring no deserialization to read a value — took another 20% off Tier 1 initial syncs. A MySQL binlog client rewrite tripled extract speed. A Parquet writer memory-footprint reduction added 30% end-to-end and got adopted by the data lake destinations.
None of those were phase-local optimizations dressed up. They were whole-system changes that a phase-local team would not have proposed, would not have been allowed to make, and would not have been able to measure.
What we learned: a reference for your own performance work
If you are an engineer or an engineering leader starting a performance effort, this is the short version of everything above.
- Pick one primary metric that reflects customer-perceived work. Make sure it is comparable across the systems you need to compare; if it isn't, invent a normalized version and standardize on it.
- Instrument before you optimize. Emit your own relevant metrics (volume/duration for Fivetran) at every phase boundary, per unit of work, into a queryable store. Budget weeks for this. It is not overhead; it is the foundation.
- Benchmark before you improve. Build a repeatable experiment covering your product's primary modes of operation. Pin every environment variable you can and write down the ones you can't.
- Use a standard dataset/pattern if one exists. Know its biases, write them down, and don't let dataset perfectionism delay you.
- Build a tool that visualizes one unit of work over time. Aggregates tell you that it's slow. A timeline tells you where. Then put the tool in a branch or repo where everyone can use it.
- Record every result, including regressions and baseline changes, with explanations. Historical context is what stops you re-litigating the same question every six months.
- Expect more than half your ideas to fail, and say so out loud. This is a cultural precondition, not a statistic.
- Keep an ordered queue of changes and test them one at a time. Know the effect of each change, good or bad.
- Time-box open-ended experiments and infrastructure fights. Give every experiment an end condition when you start it.
- Write down negative results with the reason why.
- Optimize the whole system, not the parts. Local optimizations move bottlenecks; they don't remove them.
- If your org boundaries match your pipeline phases, form a cross-cutting team and suspend the boundaries. Explicitly, in writing, with leadership backing.
- Protect the team's focus for real. No on-call, no escalations, no home-team meetings. If you can't do that, you're running a working group, not a tiger team.
- Trust your teammates' measurements. We wasted weeks re-proving results because we didn't always trust measurements. If a number is in doubt, hold one deep-dive session and work it out with the team instead of re-running the investigation.
- Stabilize the environment before you draw conclusions from it. Benchmarking on unstable infrastructure produces findings about the infrastructure, not about your code.
From a temporary team to a permanent capability
A tiger team is a bet that a temporary structure can solve a problem that the permanent structure can't. That bet has an expiration date. If you leave the tiger team in place forever, you have simply reorganized — badly, since its members now have two homes.
We reviewed Team Ellison's progress two weeks before the end of each quarter and decided each time whether to continue. When the program hit its goals, we closed it and disbanded Ellison. Its documentation stayed online as a historical record, with people still reading notes from years back.
Performance is not a project you finish. The moment you stop measuring, entropy takes back the gains: a dependency upgrade, an innocuous refactor in a hot loop, a new default in a destination client. What we needed was not another program but a permanent capability.
That is our Team DeWitt, named for David DeWitt, the computer scientist behind much of the foundational research in database systems and benchmarking. DeWitt sits within Platform Engineering and owns:
- sync throughput and latency improvements
- infrastructure and runtime efficiency
- benchmarking and performance experimentation
- profiling, diagnostics, and bottleneck analysis
- performance tooling, automation, and regression prevention
- long-term scalability and improved cost margins without linear infrastructure cost growth
The scope deliberately grew beyond connector-level tuning into platform-wide performance engineering. DeWitt runs a quarterly roadmap, maintains the benchmark suite, and — a detail I think is underrated — sometimes works directly with Sales and Sales Engineering to engineer performance improvements for a specific customer situation. Performance is a feature that customers buy from Fivetran, and having a team that can be pointed at a live deal is a genuine commercial advantage.
Two years on, the practices from the tiger team are simply how Fivetran does performance work. The benchmarks run three times a week whether or not anyone is watching. The Benchmark Improvement Record still gets new entries. The queue of changes is still a queue.
And then the ground shifted under all of it.
[CTA_MODULE]
Artículos relacionados
Empieza gratis
Únete a los miles de empresas que usan Fivetran para centralizar y transformar sus datos.